Recap of US Markets
STOCKS
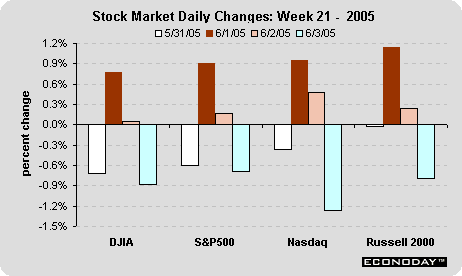
Stock prices were mostly down on sluggish economic news this week. The only positive news to lift stock prices were comments by Richard Fisher, president of the Dallas Fed, who said the Fed may be near the end of its tightening cycle. Fisher lifted spirits in both the bond and equity markets, that is before he quickly backpedaled stressing the Fed needed to make sure that inflation was indeed under control. Fisher is new to the Fed-speak game and may not have initially realized what impact his remarks would make. In his book, A Term at the Fed, former Fed governor Larry Meyer reiterates that governors and Fed presidents are free to make whatever comments they wish - their comments don't have to be approved by Greenspan. It is not likely that Dallas Fed President Fisher was speaking for anyone but himself.
The bullish sentiment was short-lived in the market - as a smaller-than-expected rise in nonfarm payrolls dashed hopes of a robust economy. All major stock indexes declined sharply on Friday. Despite the Friday drop, though, the Russell 2000 managed to post a small gain from a week ago. The Wilshire 5000 was unchanged compared to last week, but the Dow, S&P 500 and the Nasdaq composite all posted weekly declines.
BONDS
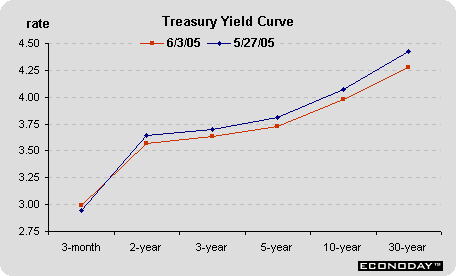
Two questions are roiling the bond markets this week. Will the yield curve invert' Will the Fed stop their rate hikes soon'
The yield curve has not yet inverted, although it certainly flattened more dramatically after the weaker-than-expected nonfarm payroll figure for May. While the bond market rallied on the news, yields started heading back from their lows and by day's end, were down about 10 basis points from Thursday's close. The spread between the 10-year note and the 2-year note has narrowed to 41 basis points. Historically, a yield curve inversion has preceded recessions. It is not yet commonly believed among market players that this drop at the long end of the market is signaling recession. Many believe that the low yields reflect liquidity imbalances in the global market. Since long bond yields are even lower in other countries, the demand for U.S. Treasury securities is strong.
The Fed question is also interesting. Dallas Fed's Fisher, at least initially, claimed the Fed was in the "eighth inning" of a tightening cycle. Before seeing May's employment report, I would have taken Fisher's comments with a big grain of salt. However, if the employment situation indeed signals that economic activity has moderated more significantly lately, this would give the Fed more leeway in pausing their rate hikes this summer. On the other hand, a pundit suggested that Greenspan wants to make sure that inflation will be wiped out and not be an issue when he hands over the reins of the chairmanship in 2006. After 18 years in his position, Greenspan would not want to be remembered as soft on inflation.
How soon can the Fed stop tightening rates' Economists are convinced that the Fed can't stop until the fed funds rate target is somewhere in the neutral zone (of 3.5 to 4.5 percent). At 3 percent today, the Fed will touch the bottom of the neutral zone with two more measured increases of 25 basis points. The next FOMC meeting is a two-day meeting on June 29-30. The Fed next will meet on August 9.
The questions are tough indeed. It is no wonder that market players are anxiously awaiting Greenspan's remarks on Monday night and Thursday.
Markets at a Glance
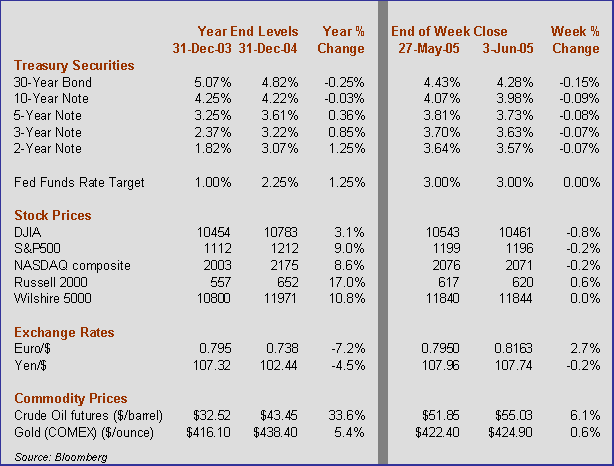
Weekly percent change column reflects percent changes for all components except interest rates. Interest rate changes are reflected in simple differences.
The Economy
Anemic payroll gain
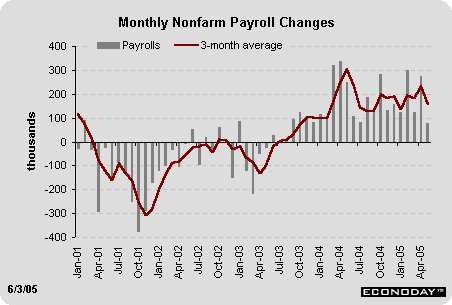
Nonfarm payrolls increased only 78,000 in May, well below expectations and only a fraction of the 274,000 gain posted in April. This puts the three-month moving average at 158,000, just barely in line with the kind of average growth one would expect during a mature phase of an expansion. While the U.S. economy is certainly in the mature phase of the expansion, given that the recovery began in the fourth quarter of 2001, the same cannot be said for employment which only in January of this year finally reached a new peak. The chart below shows the sluggish behavior of the labor market between 2001 and 2004. While we did see a few months in which payroll growth surpassed 300,000, we should have seen more months like these. After all is said and done, the payroll figures are about in line with a mature expansion, but we should be experiencing better growth.
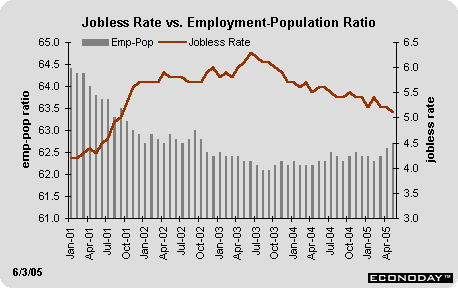
Jobless rate inches lower
The civilian unemployment rate inched down to 5.1 percent in May after remaining at 5.2 percent in the two previous months. The change is not considered statistically significant, but the downward trend is promising, particularly since nearly one million people joined the labor force in April and May and just about the same number of people found jobs over this two-month period. As a result, the employment-to-population ratio increased for the second straight month to 62.7, reaching its highest level since October 2002.
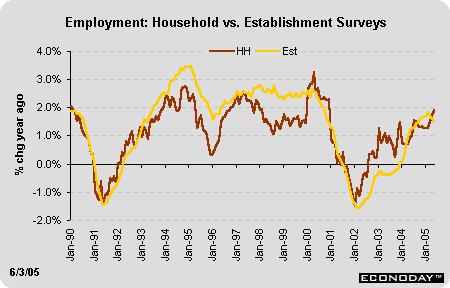
It is not unusual to see a disparity from time to time between the household survey (which generates the unemployment rate) and the establishment survey. The household survey includes self-employed workers as well as farm workers. The payroll figures don't include workers on strike. But strikes and the farm sector are not likely causing recent discrepancies. Most economists prefer the nonfarm payroll data, claiming they are more reliable. In our view, it is usually more prudent to look at both surveys before making any conclusions. On the whole, it appears that year-over-year changes reveal that nonfarm payrolls and household employment are nearly on par. However, the payroll figures took a turn and are starting to show less growth. The household survey appears poised for an upswing. To be honest, I'm not sure what we can make of that at this point. Nonetheless, it is definitely useful to look at both surveys. By that measure, the May payroll figures don't look as bad, and the household figures don't look as good!
Looking ahead to industrial production and personal income
The employment report is useful in helping to predict other economic indicators for the month. Factory payrolls fell 7,000 in May, less than 0.1 percent. At the same time, the factory workweek declined 0.2 percent during the month. These figures suggest that industrial production will once again be anemic - with a potential 0.1 to 0.3 percent drop - absent strong gains in the utilities and mining sector. (This is based only on the employment report; the market consensus could show a different production forecast because economists look at factors other than employment when predicting industrial production. Our view is that this report is useful at giving a flavor of what manufacturing production will look like based solely on factory payrolls and the workweek.)
Private nonfarm payrolls increased 0.1 percent in May while the average workweek remained unchanged and average hourly earnings increased 0.2 percent. This suggests that the wages and salaries portion of personal income will post a modest gain of less than 0.2 percent. In April, the healthy employment report led to a 0.7 percent hike in wages and salaries (which are the lion's share of personal income).
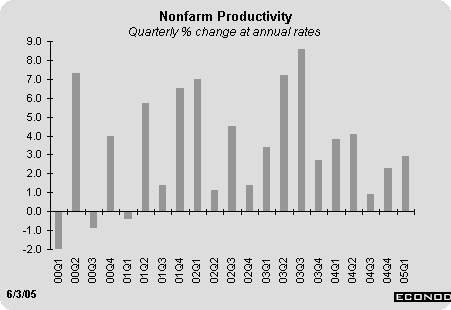
Productivity accelerates in Q1
Nonfarm productivity increased at a 2.9 percent rate in the first quarter of 2005 after increasing at a slower pace in the second half of 2004. Productivity is a two-edged sword. While it allows employers to increase wages without generating inflationary pressures, it also reduces the demand for labor in the short run. More than one economist has suggested that the sluggish employment recovery was due to the robust pace of productivity growth over the past few years. That is probably true. However, it is important to remember that robust GDP growth also plays a factor in creating labor demand. And GDP growth was solid during this period, but not exceptional.
ISM surveys show marked slowdown
Wow! A picture speaks a thousand words, doesn't it' The ISM manufacturing index fell back to 51.4 in May after declining in April as well. In fact, the chart below shows that the manufacturing index peaked in early 2004 and has slid ever since. Any level above 50 still reflects an expanding manufacturing sector. And since the index stood at 51.4 in May, it means that manufacturing activity was still growing. However, there is no question that this sector has moderated sharply. The index of industrial production confirms that growth peaked in early 2004 and has moderated ever since.
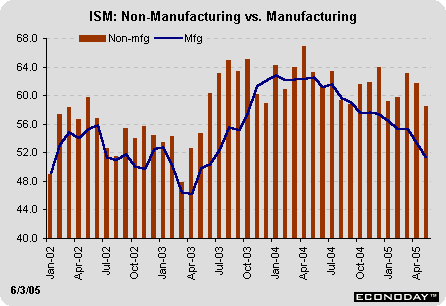
The business activity index from the ISM non-manufacturing survey also dropped sharply in May, to a level of 58.5 from 61.7 in April and 63.1 in March. It appears that business activity in the non-manufacturing sector is not consistently lower month by month, but there is no question that a downward trend is also evident in this survey. While the ISM surveys are qualitative rather than quantitative, one can't say how much business activity has actually moderated. But it does look like second quarter activity is not as strong.
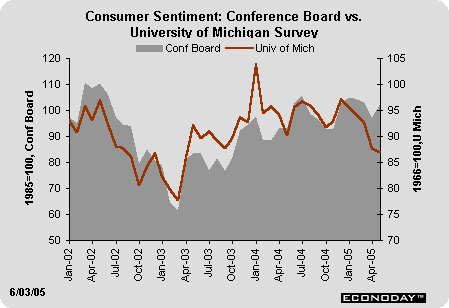
Divergence in confidence surveys
The Conference Board's consumer confidence index gained nearly five points in May and rose to 102.2, a significant improvement over April. This is in contrast to the University of Michigan's consumer sentiment index, which continued to slide in May to 86.9. Discrepancies between these two surveys are not unusual. In fact, notice that the Conference Board measure showed much more optimism among consumers in early 2004 than the University of Michigan's index.
One of the primary differences between these two surveys (aside from sample size with the Conference Board's index 10 times larger) is that the Conference Board survey focuses on employment while the University of Michigan focuses on personal finances. Oddly enough, while more respondants felt that jobs were plentiful in May than in April (22.6 vs. 20.4), more respondants also felt that jobs were hard to get in May than in April (24.2 vs. 22.9). With respect to the University of Michigan survey, finances were hurt by high gasoline prices, no doubt.
The Bottom Line
The May employment report and the ISM surveys suggest that economic activity was moderating in May - and market players are left to wonder whether or not this slower trend will continue into June. Retailers' reported chain store sales - and primarily complained about the weather, claiming that May was unseasonably cold. Could this have affected other business activity as well' One wouldn't expect that to be the case, but we (economists) have never explained "animal spirits" either.
The employment situation often sets the tone for the month - and if this tradition follows through this month, then many of the economic indicators are likely to be more anemic than not. Certainly ISM surveys were weaker than the previous month. And based on the employment and earnings figures, it is likely that industrial production and personal income growth will be on the sluggish side in May as well.
Economic indicators will be somewhat sparse in the upcoming week. However, Fed Chairman Alan Greenspan is speaking on Monday night as well as testifying before the Joint Economic Committee on Thursday. That counts for two market-moving events!
Looking Ahead: Week of June 6 to June 10
Tuesday
Consumer installment credit expanded only $5.6 billion in March, roughly the same pace as in February. Stronger motor vehicle sales in April may lead to an acceleration for the month.
Consumer credit Consensus Forecast for Apr 05: $8 billion
Range: $4.8 to $9.8 billion
Thursday
New jobless claims jumped 25,000 in the week ended May 28 to 350,000. The four-week moving average increased marginally to 334,500 for the week. May's average claim level was up 3.9 percent from April. That is not surprising in light of the sluggish payroll gain for the month.
Jobless Claims Consensus Forecast for 6/4/05: 335,000 (2,000)
Range: 325,000 to 350,000
Friday
Import prices increased 0.8 percent in April, much less than in March. Non-oil import prices increased 0.4 percent during the month, posting the largest gain since last December. Crude oil prices moderated in May and this could help dampen the import price index for the month.
Import prices Consensus Forecast for May 05: -0.3 percent
Range: -0.6 to 0.8 percent
The international trade deficit on goods and services narrowed dramatically in March to show a $55 billion shortfall for the month. Exports rose and imports fell for the month. However, key West Coast ports are still extremely busy unloading ships - and this suggests that March's improvement is not likely to persist.
International trade balance Consensus Forecast for Apr 05: $-58 billion
Range: $-60 to $-57 billion
The U.S. Treasury is scheduled to release the monthly budget report for May. Over the past 10 years, the average deficit amounted to $46.9 billion. However, the deficit was only $62.5 billion last year.
Treasury budget Consensus Forecast for May 04: $-55 billion
Range: $-65.3 to $-40 billion

