Recap of US Markets
STOCKS
Stock prices rose at a good clip this week despite surging oil prices. Crude oil futures prices surpassed $58 per barrel Friday, but even this spurt didn't dampen spirits in the equity market. The major stock indexes did not post a drop any day this week. This helped propel the S&P 500 to levels last seen in 2004. While both the Dow Jones Industrials and the Russell 2000 grew sharply, they are still below year-end levels. The Nasdaq composite index is the worst performer among this group, remaining nearly 4 percent below year-end levels. Perhaps equity investors are currently ignoring surging oil prices because both the CPI and the PPI posted good news in May. But the good news may not last long if it means that pump prices will be begin rising again.

BONDS
Treasury yields didn't change much this past week relative to last week, but the chart below underscores how much the yield curve truly has flattened in the past twelve months. In contrast to Fed Chairman Alan Greenspan, who believes the flattening yield curve still cannot be explained, St. Louis Federal Reserve President William Poole offered his own view. He doesn't think that the current environment is unusual at all. According to Poole, the 10-year yield curve is based on expectations on where yields will be in the future, not what is happening now. To some extent, this would imply that investors are convinced that inflation will remain low over the next 10 years.

Markets at a Glance

Weekly percent change column reflects percent changes for all components except interest rates. Interest rate changes are reflected in simple differences.
The Economy
No inflation worries...for now
After posting large gains in February, March and April, two key inflation measures declined in May. The producer price index plunged 0.6 percent for the month and the consumer price index dipped 0.1 percent. It isn't unusual to see declines in the producer price index, but decreases in the consumer price index are less frequent.

May's energy prices were responsible for the better inflation news. These fell 3.5 percent in the PPI, but only 2 percent in the CPI in May. On a year-over-year basis, the PPI is registering a 10.2 percent gain for energy prices while the CPI is showing a whopping 28.7 percent hike from a year ago.
Excluding energy and food prices, the producer price index inched up 0.1 percent, in line with recent monthly gains. Similarly, the core CPI also increased 0.1 percent for the month. Housing, which accounts for more than 40 percent of the CPI, increased only 0.1 percent, keeping a lid on the total CPI.

On a year-over-year basis, the producer price index rose 3.5 percent in May, its best showing since September last year. Similarly, the consumer price index also had its smallest rise since September, posting a 2.8 percent year-over-year gain. For the third straight month, the core PPI (excluding food and energy prices) rose 2.6 percent versus a year ago. The core CPI rose 2.2 percent from last May, posting this pace for the fifth time in seven months.
It is certainly too early to tell, but it appears as though we have seen the worst inflation rates already - at least with respect to the core components. Certainly, inflation will accelerate further in coming months on the energy side (crude oil prices are shooting up again). This would certainly be viewed favorably by Fed officials whose job it is to make sure that inflationary pressures are contained. It is worth noting, however, that the Beige Book indicated some wage pressures in a few districts (San Francisco and Dallas) as well as some price pressures. There is no question that Fed officials - and market players - need to be vigilant on inflation in coming months. But at least this week's news was good.
Are consumers taking a break'
Retail sales fell 0.5 percent in May after increasing 1.5 percent in April due primarily to a 1.6 percent drop in motor vehicle sales. However, nonauto sales also dipped, down 0.2 percent in May after posting a strong 1.4 percent gain in April. Excluding autos and gas station sales, retail sales were unchanged in May after rising 1.3 percent in April.

May sales were sluggish in several categories including electronics & appliances stores, gas stations, clothing & accessories stores, general merchandise (department stores), nonstore retailers and foods services & drinking places. Often, when declines are in so many categories, it is a good idea to consider what happened in the previous month. Indeed, increases were very sharp across all categories in April. Sometimes, this is a sign that seasonal adjustment factors are not perfectly capturing all the seasonal movement in each month. In any case, it is useful to look at the long-term trends. Notice in the chart above that retail sales were exceptional in April, but sluggish in March and May.
Taking a three-month average suggests that retail sales are running 0.4 - 0.5 percent per month. That is not very different from the pace registered in the three previous months (December to February). Indeed, the chart above does point to choppy consumer spending from one month to the next. Long-term averages suggest that retail sales increased 0.6 percent per month from January 2004 through May 2005. So, near term spending is just a little bit softer, but not by much.
Housing starts hold at high levels
Housing starts inched up 0.2 percent in May to a 2.009 million unit rate after surging 9.4 percent in April to a 2.005 million unit rate. Single-family housing starts jumped 4.7 percent in May to a 1.704 million-unit rate, although multi-family housing starts plunged 19.3 percent for the month. There is no question that consumers are taking advantage of low mortgage rates - still hovering at roughly the same levels we have seen for over a year.
At some point, however, we may see a slowdown in housing activity. In the first five months of 2005, housing starts have averaged a rate of 2.053 million units per month. According to housing experts, a sustainable rate would be closer to 1.9 million units. The rate is determined by household formation, the normal trend for vacation and second homes, and takes into account annual obsolescence. (Many homes are indeed knocked down to make room for new and better homes!)

Production grows modestly in May
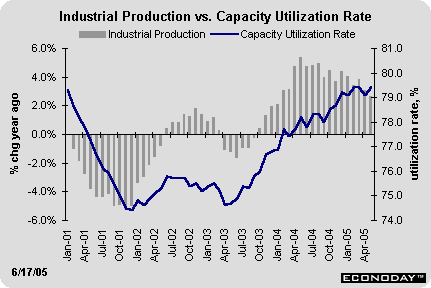
The index of industrial production increased 0.4 percent in May, just about offsetting April's 0.3 percent drop. Production growth has been very soggy lately even after taking into account April and May declines in utilities. Manufacturing production increased 0.6 percent in May, but decreased in both March and April.

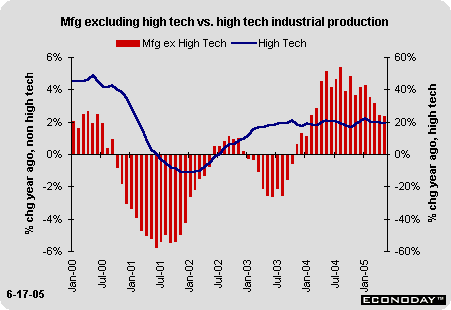
It is ironic that the Nasdaq composite index has grown less rapidly than other major stock indexes such as the Dow Jones Industrials, since production in the high tech sector has remained substantially stronger than overall manufacturing. In May, high tech production grew 2.3 percent, while manufacturing excluding high tech increased only 0.5 percent for the month. The chart below shows year-over-year growth in high tech industries (which account for roughly 4 1/2 percent of the total industry) and non-high tech manufacturing (which accounts for roughly 77 1/2 percent of total industry, the remainder is due to utilities and mining). Notice that high tech production has consistently posted year-over-year gains of 20 percent for about two years. At the same time, non-high tech manufacturing accelerated in 2004, but growth peaked in August of that year and has since moderated to less than 2 1/2 percent in the past few months.

Fed surveys give mixed signals for June
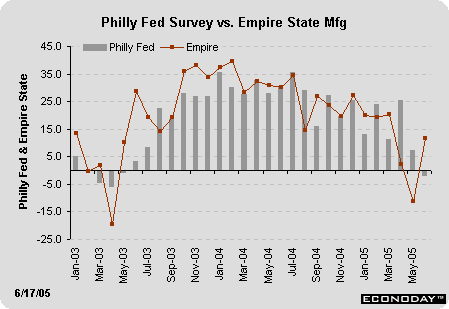
The New York Fed's Empire State manufacturing survey jumped sharply in June to a level of 11.65 from May's level of -11.06. It appears as though manufacturing activity is on the mend in this region after a two-month pause (the April level was near zero). In contrast, the Philadelphia Fed's business outlook survey dropped below the zero line in June to -2.2, after declining to a level of 7.3 in May from April's high of 25.3. One might expect the Philadelphia region and the New York region to be similar just because of proximity. However, they do not necessarily have identical manufacturing industries. It remains to be seen which industry is more indicative of the nation. Market players will be looking forward to the NAPM-Chicago and the ISM manufacturing surveys in the next couple of weeks.

The Bottom Line
Market players certainly had plenty of economic news to keep them hopping this week. Inflation news was certainly friendly in May as both the PPI and the CPI declined for the month. Even after accounting for the volatile components, the core PPI and CPI posted only modest gains.
Consumers may have been resting in May after their April shopping spree. It isn't unusual to see choppy growth patterns in monthly retail sales. If sales are sluggish again in June, though, perhaps retailers should be more concerned about sales.
Housing levels remain strong, although since we are accustomed to measuring growth in economic activity, rather than the level of activity, the fact that housing starts were roughly unchanged from last month points to no growth in the housing market.

