|
Global central bankers have generally taken a breather the past couple of months, keeping rates steady and waiting for the slowing effects of prior rate hikes to take hold. But much of the recent data, especially employment, are not showing much if any slowing reflected in Econoday’s Relative Performance Index which ends the week at 12 to indicate modest outperformance relative to economist forecasts. Inflation data are largely meeting forecasts, though levels remain highly elevated and continue to squeeze households. European Central Bank officials have been careful to keep open the possibility of future rate hikes; on Tuesday, Chief Economist Philip Lane repeated there is "still work to be done" in bringing inflation back to the bank's two percent target. The ECB, though slow to begin raising rates this cycle, has turned out to be especially persistent in contrast to other banks where a sense of hesitant caution is definitely apparent.
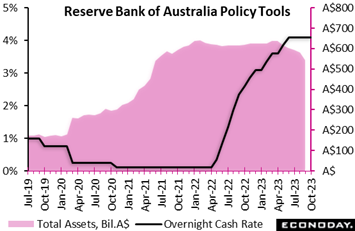 For the fourth consecutive meeting, the Reserve Bank of Australia left its overnight cash rate unchanged at 4.10 percent, in line with the consensus forecast. This meeting was the first presided by incoming Governor Michele Bullock; her long experience as a senior RBA official suggests there will be continuity in the bank’s approach to policy and governance under her leadership. For the fourth consecutive meeting, the Reserve Bank of Australia left its overnight cash rate unchanged at 4.10 percent, in line with the consensus forecast. This meeting was the first presided by incoming Governor Michele Bullock; her long experience as a senior RBA official suggests there will be continuity in the bank’s approach to policy and governance under her leadership.
In the statement, officials argued that inflation "has passed its peak but is still too high and will remain so for some time yet". Monthly CPI data published in the prior week showed an increase in headline inflation from 4.9 percent in July to 5.2 percent in August, mainly reflecting higher fuel prices. The measure of underlying inflation, however, fell from 5.8 to 5.5 percent, closer to the RBA's target range of two percent to three percent. Officials remain confident that inflation will fall towards their target range over the forecast period but again highlighted upside risks to the inflation outlook.
Officials also remain concerned about risks to the growth outlook associated with the substantial policy tightening they have already implemented over the last 18 months. They again noted that the economy is currently growing below its trend rate and is expected to do so "for a while".
Reflecting this assessment, officials again reached the conclusion they reached last month that it is appropriate to leave policy rates on hold to "provide further time to assess the impact of the increase in interest rates to date and the economic outlook". They also reiterated that "some further tightening of monetary policy may be required "to return inflation to its target range in a reasonable timeframe" and reaffirmed that they "will do what is necessary to achieve that", depending on incoming data.
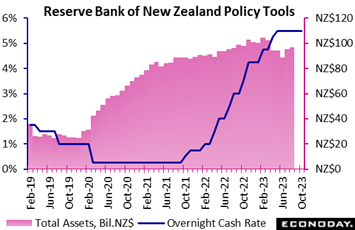 The Reserve Bank of New Zealand left its official cash rate unchanged at 5.50 percent for the third consecutive meeting, in line with the consensus forecast. Prior to this pause, officials had increased policy rates by a cumulative 525 basis points since October 2021 as part of efforts to return inflation to their target range of one percent to three percent. The Reserve Bank of New Zealand left its official cash rate unchanged at 5.50 percent for the third consecutive meeting, in line with the consensus forecast. Prior to this pause, officials had increased policy rates by a cumulative 525 basis points since October 2021 as part of efforts to return inflation to their target range of one percent to three percent.
Headline CPI inflation fell to 6.0 percent in the three months to June from 6.7 percent in the three months to March, with core inflation easing from 7.3 percent to 7.1 percent. Officials still expect inflation to decline back to the target range in the second half of 2024, but the statement accompanying the latest decision highlights the risk that price pressures will not slow as much as expected. The statement also notes that previous policy tightening is continuing to constrain domestic spending, with officials forecasting GDP growth to remain subdued in coming quarters.
Reflecting this assessment, leaving rates on hold again suggests officials remain confident for now that current policy settings are sufficiently restrictive to return inflation to their target range. Nevertheless, it also appears they have retained a bias to tighten further if inflation does not fall as quickly as they anticipate. Officials again concluded that policy will need to remain restrictive "for the foreseeable future".
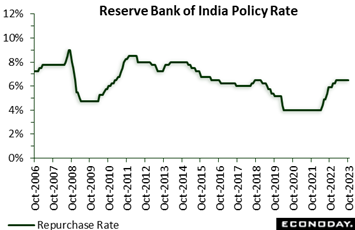 The Reserve Bank of India left its repurchase rate unchanged at 6.50 percent in line with the consensus forecast. This rate has been increased by a cumulative 250 basis points since the initial rate hike by officials in May last year but has now been left on hold for four consecutive meetings. The Reserve Bank of India left its repurchase rate unchanged at 6.50 percent in line with the consensus forecast. This rate has been increased by a cumulative 250 basis points since the initial rate hike by officials in May last year but has now been left on hold for four consecutive meetings.
Data released since the RBI's previous meeting in early August show headline CPI inflation rising from 4.87 percent in July to 7.44 percent in August before moderating to 6.83 percent in September. This increase in price pressures over the last two months has taken headline inflation back above the RBI's target range of two percent to six percent but has mainly been driven by higher food prices caused by adverse weather conditions. Officials had anticipated such a spike in food prices at their last meeting.
In their latest statement, RBI officials expect headline inflation will moderate further but cautioned that the outlook remains "clouded' by uncertainties" relating to domestic food prices and global energy prices. They forecast quarterly inflation will ease from 6.4 percent in the current quarter to 5.6 percent and 5.2 percent respectively in the last two quarters of the current fiscal year.
Economic activity remains resilient with officials forecasting GDP growth of 6.5 percent in the current fiscal year, with ongoing support from government investment spending and strong conditions in the services sector. Yet officials remain confident that prior tightening will return headline inflation to its target range in due course. Upside risks to the inflation outlook, however, will likely remain a major focus for officials in upcoming meetings.
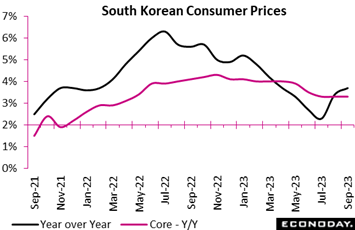 South Korea's headline consumer price index rose 3.7 percent on the year in September, picking up further from an increase of 3.4 percent in August and moving further above the Bank of Korea's two percent target. On the month, the index advanced 0.6 percent after increasing 1.0 percent previously. South Korea's headline consumer price index rose 3.7 percent on the year in September, picking up further from an increase of 3.4 percent in August and moving further above the Bank of Korea's two percent target. On the month, the index advanced 0.6 percent after increasing 1.0 percent previously.
This increase in headline inflation reflects a bigger increase in food prices. These rose 1.6 percent on the month, with food price inflation picking up from 4.9 percent to 5.1 percent on the year. Transport costs also picked up, advancing 0.1 percent on the year after a previous decline of 2.5 percent.
Underlying price pressures, in contrast, were steady in September. Core CPI, excluding food and energy, rose 3.3 percent on the year, unchanged from the pace recorded in both July and August, and fell 0.1 percent on the month after a previous increase of 0.3 percent. Several categories of spending recorded smaller year-over-year price increases including housing and utilities, communication, and restaurants and hotels.
At its most recent policy meeting in late August, the BoK left policy rates on hold for the fifth meeting in a row after they increased rates by a cumulative 275 basis points since late 2021. Officials noted then that the recent fall in inflation partly reflected base effects of previous increases in global oil prices and advised they expect headline inflation would increase again in coming months. Though showing higher headline inflation, August’s results are consistent with their assessment, and the ongoing stability in underlying inflation will likely reinforce the case for policy to remain on hold in coming months.
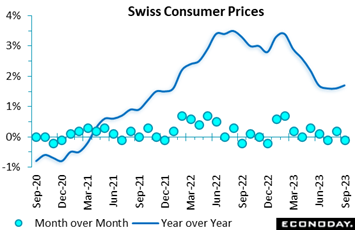 Inflation did accelerate in September for the first time since February but not by much, from August's 1.6 percent to 1.7 percent. On the month, inflation fell 0.1 percent. Looking at domestic prices, they fell 0.2 percent on the month, shaving their yearly rate from 2.2 percent to 2.1 percent. Import prices climbed 0.3 percent to boost their annual rate from 0.3 percent to 0.5 percent. Inflation did accelerate in September for the first time since February but not by much, from August's 1.6 percent to 1.7 percent. On the month, inflation fell 0.1 percent. Looking at domestic prices, they fell 0.2 percent on the month, shaving their yearly rate from 2.2 percent to 2.1 percent. Import prices climbed 0.3 percent to boost their annual rate from 0.3 percent to 0.5 percent.
Within the CPI, the main upward pressure on the monthly change came from petroleum products where a 3.0 percent spike added almost 0.1 percentage point. A largely seasonal 2.7 percent bounce in clothing and footwear also provided a boost. However, these effects were more than offset by declines elsewhere, notably restaurants and hotels (1.3 percent on the month), food and soft drink (0.5 percent) and alcohol and tobacco (0.4 percent). As a result core prices, which exclude unprocessed food and energy, decreased 0.1 percent versus August, reducing the annual underlying rate from 1.5 percent to just 1.3 percent. This matched its lowest mark since January 2022.
The Swiss National Bank should be quite happy with September’s data. Both headline and core inflation have been below 2 percent since June and underlying inflation has fallen every month since April.
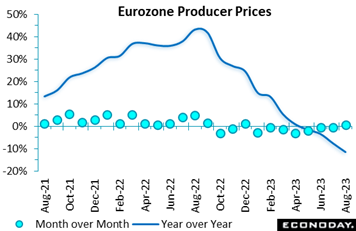 Producer prices in Germany were just marginally firmer than expected in August. A 0.6 percent monthly rise was the first increase since last December but, with base effects strongly negative, still small enough to slash the annual inflation rate from July's minus 7.6 percent to minus 11.5 percent, another new record low. Producer prices in Germany were just marginally firmer than expected in August. A 0.6 percent monthly rise was the first increase since last December but, with base effects strongly negative, still small enough to slash the annual inflation rate from July's minus 7.6 percent to minus 11.5 percent, another new record low.
As it is, the monthly headline gain was dominated by energy where prices jumped fully 2.5 percent. Excluding this category, the PPI fell again, down 0.2 percent to trim the yearly underlying rate from 1.6 percent to 1.0 percent. This is the lowest annual core rate since January 2021 and some 15 percentage points short of its May 2022 peak. Prices of intermediates fell a monthly 0.4 percent and consumer durables 0.1 percent. Consumer non-durables and capital goods were flat.
Regionally, France (0.6 percent), Germany (0.3 percent), Italy (0.7 percent) and Spain (1.2 percent) all posted monthly gains as did most of the smaller states.
Despite a relatively robust headline print, another fall in core prices shows that underlying inflation is still trending down, in line with a clearly very weak Eurozone manufacturing sector.
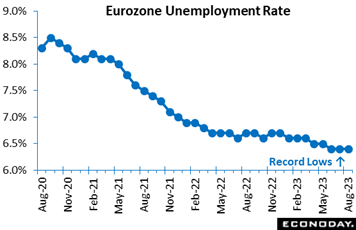 The Eurozone labour tightened in August. Following an upwardly revised 89,000 jump in July, the mid-quarter month saw a hefty 107,000 decline that reduced the number of people out of work to 10.856 million, a new record low. As a result, the unemployment rate dipped from an upwardly amended 6.5 percent to 6.4 percent, matching both the market consensus and June's all-time low. The Eurozone labour tightened in August. Following an upwardly revised 89,000 jump in July, the mid-quarter month saw a hefty 107,000 decline that reduced the number of people out of work to 10.856 million, a new record low. As a result, the unemployment rate dipped from an upwardly amended 6.5 percent to 6.4 percent, matching both the market consensus and June's all-time low.
Regionally, the national rate fell in France (7.3 percent after 7.4 percent), Italy (7.3 percent after 7.5 percent) and Spain (11.5 percent after 11.6 percent) and was again flat in Germany (3.0 percent).
The August update shows that the overall Eurozone labour market remains very tight. This will worry the ECB's hawks and increases the likelihood of the first cut in official interest rates being deferred until well into 2024.
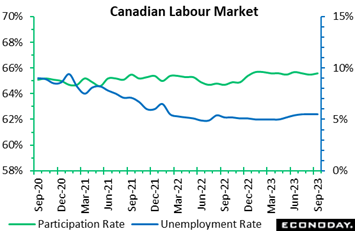 There was another big surprise in Canada where employment surged 63,800 in September, three times as much as expected after the economy added nearly 40,000 jobs in August. The unemployment rate remained steady at 5.5 percent, tighter than the 5.6 percent consensus with the participation rate edging up to 65.6 percent from 65.5 percent. Year-over-year wage growth picked up to 5.0 percent from 4.9 percent, none of it reassuring for the Bank of Canada. There was another big surprise in Canada where employment surged 63,800 in September, three times as much as expected after the economy added nearly 40,000 jobs in August. The unemployment rate remained steady at 5.5 percent, tighter than the 5.6 percent consensus with the participation rate edging up to 65.6 percent from 65.5 percent. Year-over-year wage growth picked up to 5.0 percent from 4.9 percent, none of it reassuring for the Bank of Canada.
Yet the breakdown is not as strong as the headline suggests. Employment gains were led by a 47,900 increase in part-time jobs, while full-time jobs were up a less dramatic 15,800. The number of employees rose 37,800 but nearly all of it was in the public sector, which added 36,600 positions. Self-employment, not as reflective of a healthy job market as full-time employees, continued to increase with a 26,100 advance over the month.
Looking at the sector breakdown, goods-producing industries shed 10,500 jobs as construction dropped 17,500 in September only partly offset by an 8,800 increase in manufacturing.
The services sector, by contrast, added 74,300 positions led by a 65,800 surge in educational services, an 18,900 increase in transportation and an 11,000 rise in accommodation and food services, together totaling 95,700 jobs. Three service sectors posted declines on the month totaling 42,600: finance, insurance, real estate, rental and leasing lost 19,800 jobs; information, culture and recreation was down 12,100; and wholesale and retail trade fell 10,700. All other services recorded gains.
Employment was up 139,700 over the third quarter, following a 142,700 increase in the second quarter.
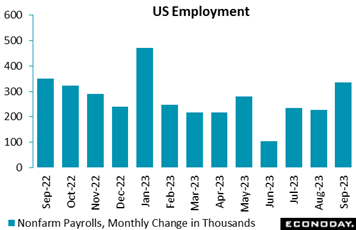 US nonfarm payrolls jumped 336,000 in September after a net upward revision of 119,000 to the prior two months. The September level more than doubled Econoday’s 160,000 consensus and exceeded the consensus range by 100,000. The monthly average increase for the third quarter came in at 226,000, stronger than 201,000 in the second quarter and not far below 312,000 in the first quarter. US nonfarm payrolls jumped 336,000 in September after a net upward revision of 119,000 to the prior two months. The September level more than doubled Econoday’s 160,000 consensus and exceeded the consensus range by 100,000. The monthly average increase for the third quarter came in at 226,000, stronger than 201,000 in the second quarter and not far below 312,000 in the first quarter.
Much of September’s gains were tied to a rise of 96,000 in leisure and hospitality, while much of the government’s sizable 73,000 increase was for education where 29,100 jobs were added at the state level and 10,800 at the local level. Nevertheless, state government excluding education added 26,600 jobs as well. Rounding out the gains were construction at 11,000 and also manufacturing at 17,000, the latter beating Econoday’s consensus by 6,000.
Though year-over-year wage growth slowed by only a tenth to 4.2 percent, the monthly gain edged only 0.2 percent higher for a second month in a row. Some of this likely reflects hiring in lower wage industries where competition for workers is still active, including retailers seeking workers for the upcoming winter shopping season.
The unemployment rate was unchanged at 3.8 percent and the labor participation rate also unchanged at 62.8 percent. Those working part-time for economic reasons fell 156,000 to 4.065 million in September, an indication that at least some workers are finding full-time employment. Job losers fell 56,000 to 2.858 million reflecting the low levels of layoff activity. Job leavers were little changed, down 4,000 to 797,000 indicating less churn in the labor market. It appears that many college graduates found jobs in August and partly accounted for the new entrants decrease of 29,000 to 568,000.
September’s payroll gains confirm strength in the labor also indicated by August job openings in the JOLTS report, jumping 690,000 to 9.610 million, and a noticeable ratcheting lower underway in initial jobless claims, at 207,000 in the September 30 week for a 4-week average of 208,750.
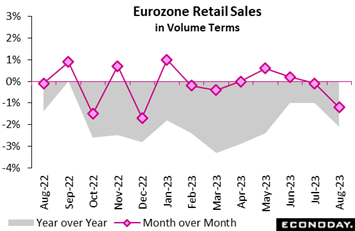 In contrast to the strength of Eurozone employment, retail sales in the Eurozone were very weak in August. A 1.2 percent monthly fall was much steeper than the market consensus and the weakest performance so far in 2023. July's drop was trimmed to just 0.1 percent but volumes now stand at their lowest level since January 2021. Annual growth was minus 2.1 percent, down from minus 1.0 percent. In contrast to the strength of Eurozone employment, retail sales in the Eurozone were very weak in August. A 1.2 percent monthly fall was much steeper than the market consensus and the weakest performance so far in 2023. July's drop was trimmed to just 0.1 percent but volumes now stand at their lowest level since January 2021. Annual growth was minus 2.1 percent, down from minus 1.0 percent.
The overall monthly decline reflected broad-base losses with purchases of food, drink and tobacco also tumbling 1.2 percent and non-food sales (ex-auto fuel) decreasing 0.9 percent. Within the latter, mail order and internet fell a hefty 4.5 percent. Auto fuel was down 3.0 percent, its fourth drop in the last five months.
Regionally, it was again Germany (minus 1.2 percent) that did much of the monthly damage but weakness here was compounded by a an especially poor period for France (minus 2.8 percent). Spain (0.4 percent) posted a modest gain and elsewhere it was the usual mixed picture.
August's update leaves average overall Eurozone volumes in July/August 0.6 percent below their average level in the second quarter. Absent any revisions, September will need an improbably sharp monthly rise of at least 2.4 percent just to keep the third quarter flat. As such August’s update increases the likelihood contraction for third-quarter GDP.
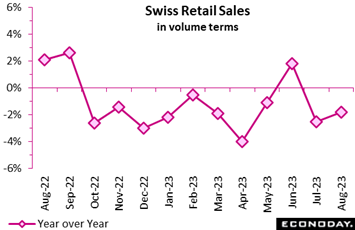 Swiss retail sales rose 0.4 percent on the month in August, barely denting a 2.4 percent slump in July. Annual growth was minus 1.8 percent, up from minus 2.5 percent but below the consensus and, apart from June, extending an unbroken run of negative prints that began back in October 2022. Swiss retail sales rose 0.4 percent on the month in August, barely denting a 2.4 percent slump in July. Annual growth was minus 1.8 percent, up from minus 2.5 percent but below the consensus and, apart from June, extending an unbroken run of negative prints that began back in October 2022.
August's monthly rise reflected a 0.8 percent increase in sales of food, drink and tobacco and 0.4 percent gain in non-food demand, excluding auto fuel. Auto fuel was down 1.7 percent.
Despite August's advance, average overall volumes in the last two months were still down 0.4 percent versus their mean level in the second quarter. Absent any revisions, September will need a monthly rise of at least a full percent if the retail sector is not to subtract from third-quarter GDP growth.
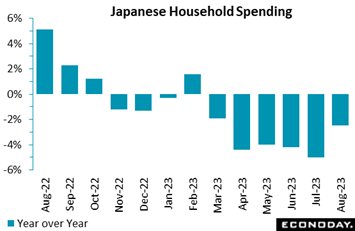 Real average spending by households with two or more people fell 2.5 percent on the year in August after falling 5.0 percent in July. August’s decline was smaller than expected but was still the ninth drop in 12 months. Moreover, the core measure of real average household spending (excluding housing, motor vehicles and remittance), a key indicator used in Japan’s GDP calculation, fell 3.2 percent on the year in August. High costs have prompted more selective consumption patterns, with many switching to discount mobile phone plans, holding simpler ceremonies and cutting after-school tutoring. Real average spending by households with two or more people fell 2.5 percent on the year in August after falling 5.0 percent in July. August’s decline was smaller than expected but was still the ninth drop in 12 months. Moreover, the core measure of real average household spending (excluding housing, motor vehicles and remittance), a key indicator used in Japan’s GDP calculation, fell 3.2 percent on the year in August. High costs have prompted more selective consumption patterns, with many switching to discount mobile phone plans, holding simpler ceremonies and cutting after-school tutoring.
In separate data, total monthly average cash earnings per regular employee in Japan rose 1.1 percent for a second straight month in August which is down from 2.3 and 2.9 percent gains in the prior two months. The slowing pace is tied to an August decline in bonuses and other special pay and no growth in overtime pay in July. In real terms, average wages fell 2.5 percent on year in August for the 17th consecutive drop after slumping 2.7 percent in July.
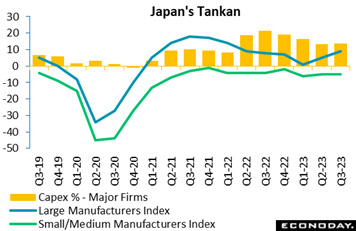 Confidence among major manufacturers in Japan picked up at a faster-than-expected pace in September as improved supply chains supported the auto industry, the heat wave boosted food and beverage makers and the recent jump in energy prices propped up refiners. These factors offset sluggish demand for production machinery amid slower global growth, according to the Bank of Japan's quarterly Tankan business survey. The Tankan index for major manufacturers jumped to 9 in September from 5 in June, coming in well above the median forecast of 6. Confidence among major manufacturers in Japan picked up at a faster-than-expected pace in September as improved supply chains supported the auto industry, the heat wave boosted food and beverage makers and the recent jump in energy prices propped up refiners. These factors offset sluggish demand for production machinery amid slower global growth, according to the Bank of Japan's quarterly Tankan business survey. The Tankan index for major manufacturers jumped to 9 in September from 5 in June, coming in well above the median forecast of 6.
Relaxed Covid restrictions are supporting restaurants, hotels, retail stores and other service providers while confidence among electricity and natural gas utilities jumped on rising profits through markups. The Tankan index measuring sentiment among major non-manufacturers rose to 27 in September from 23 in June. This was also above the median forecast of 24.
Looking ahead, large manufacturers foresee slight improvement in sentiment three months ahead and small manufacturers are seen playing catchup while non-manufacturers, particularly wholesalers and retailers as well as hotel and restaurant operators, expect a pullback in December after the latest improvement as they predict labor shortages will become worse.
Large corporations slightly revised up their plans for investment in equipment for fiscal 2023 that began in April, as largely expected, and smaller firms raised their capex plans much more sharply than forecast. Capex is generally supported by demand for automation amid labor shortages as well as government-led digital transformation and emission control.
Major firms projected their plans for business investment in equipment to rise a combined 13.6 percent on the year in fiscal 2023 ending in March 2024, revised up slightly from the 13.4 percent increase planned in the June survey and up sharply from a modest 3.2 percent planned in March.
Japanese firms see the dollar/yen exchange rate averaging ¥135.75 for fiscal 2023, up further from ¥132.43 provided in June, while assuming the euro/yen forex rate to average at ¥144.62, also up further from ¥140.11 seen three months ago.
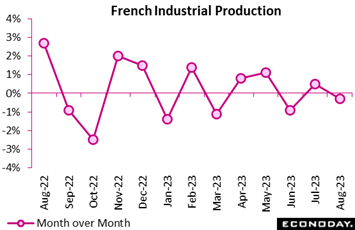 Industrial production contracted in August, largely due to a fall in manufacturing, suggesting that the French economy may have slowed through the third quarter. Output declined by 0.3 percent, in line with the consensus forecast, following a 0.5 percent gain in July. Industrial production contracted in August, largely due to a fall in manufacturing, suggesting that the French economy may have slowed through the third quarter. Output declined by 0.3 percent, in line with the consensus forecast, following a 0.5 percent gain in July.
Manufacturing output contracted by 0.4 percent month-over-month, dampened by a 1.0 percent decline in food and beverages and 1.2 percent slump in "other” manufacturing, particularly pharmaceutical products. The picture wasn't entirely gloomy; output of transport equipment increased by 3.5 percent. Away from manufacturing, construction declined by 1.4 percent month-over-month, while mining and quarrying softened by 1.3 percent.
Over the three months to August, industrial output increased by 0.4 percent, raising the prospect of the sector contributing positively to third-quarter economic growth.
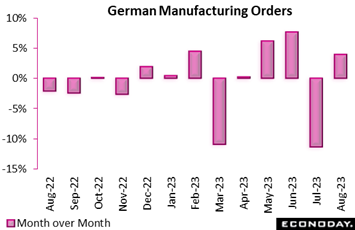 Orders in Germany have been highly volatile, rising solidly in August and June sandwiched between an 11.3 percent drop in July. August’s 3.9 percent monthly gain was stronger than expected and large enough to trim annual contraction from minus 10.1 percent to minus 4.4 percent. That said, orders are still nearly 2 percent below their pre-Covid level in February 2020. Orders in Germany have been highly volatile, rising solidly in August and June sandwiched between an 11.3 percent drop in July. August’s 3.9 percent monthly gain was stronger than expected and large enough to trim annual contraction from minus 10.1 percent to minus 4.4 percent. That said, orders are still nearly 2 percent below their pre-Covid level in February 2020.
The monthly headline rise reflected a 4.0 percent gain in the domestic market and a 3.9 percent increase in overseas demand. A rebound in computer, electronic and optical products (37.9 percent) did much of the work. More generally, intermediates climbed 9.3 percent and consumer goods 8.8 percent while capital goods edged up just 0.1 percent.
The orders data remain particularly volatile and September will need an 8.0 percent monthly bounce just to keep the third quarter flat. The bottom line is that demand is soft, leaving a subdued outlook for industrial production over coming months.
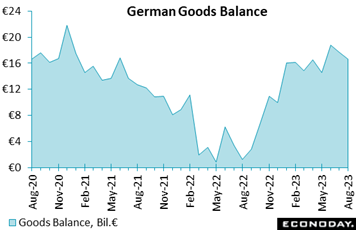 Germany’s seasonally adjusted surplus narrowed from July's €17.7 billion to €16.6 billion in August. This was €0.4 billion above the market consensus but also a 3-month low. Unadjusted, the black ink stood at €14.4 billion versus just €0.4 billion in August 2022. Germany’s seasonally adjusted surplus narrowed from July's €17.7 billion to €16.6 billion in August. This was €0.4 billion above the market consensus but also a 3-month low. Unadjusted, the black ink stood at €14.4 billion versus just €0.4 billion in August 2022.
The headline deterioration reflected falls in both exports, which were down 1.2 percent on the month, and imports, which declined 0.4 percent. Exports are now at their lowest level since March 2022 and imports at their weakest mark since January last year. Unadjusted annual growth of the former slipped from minus 1.6 percent to minus 5.8 percent and of the latter from minus 12.4 percent to minus 16.7 percent, the most negative reading since May 2020. Sales to the rest of the EU dropped a monthly 1.5 percent while imports from the region rose 1.9 percent. Exports to non-EU states fell 0.9 percent while imports were off 3.0 percent.
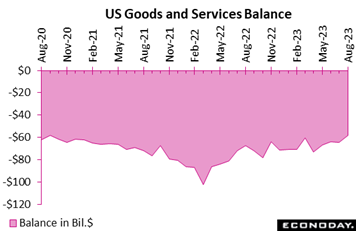 Lifted by a combination of a $4.1 billion rise in exports and a $2.3 billion fall in imports, the US trade deficit fell a sizable $6.4 billion in August to $58.3 billion for the best showing in almost three years. Lifted by a combination of a $4.1 billion rise in exports and a $2.3 billion fall in imports, the US trade deficit fell a sizable $6.4 billion in August to $58.3 billion for the best showing in almost three years.
Exports of goods (balance of payments of basis) rose $3.1 billion in the month while imports of goods fell $2.4 billion. Crude oil exports, an increasing US strength, climbed $1.5 billion to $10.3 billion while exports of capital goods, a traditional strength, climbed another $1.1 billion to $51.0 billion, the latter led by computer accessories and semiconductors.
Imports of consumer goods, the nation's traditional weakness, helped August's deficit, falling $1.9 billion to $62.6 billion and reflecting a drop in cells phones and other household goods but also a drop in capital goods, the latter a negative for US business investment. Imports and exports together, the nation's goods deficit narrowed by $5.5 billion to $84.5 billion, still enormous but, outside of $81.6 billion in March this year, the least enormous in nearly three years.
Led by travel and financial services, exports of services rose $1.0 billion in August to more than offset a $0.1 billion rise in related imports to leave the services surplus – always a strength in the US balance – at $26.2 billion.
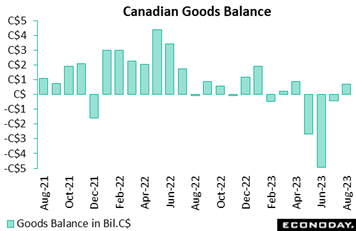 Following a month of disruptions in port operations in British Columbia, trade activity in Canada increased in August, leading to an unexpected surplus of C$718 million after a deficit of C$437 million in July, less than half the size of the initial estimate. A 5.7 percent month-to-month gain in exports outpaced a 3.8 percent advance in imports. Following a month of disruptions in port operations in British Columbia, trade activity in Canada increased in August, leading to an unexpected surplus of C$718 million after a deficit of C$437 million in July, less than half the size of the initial estimate. A 5.7 percent month-to-month gain in exports outpaced a 3.8 percent advance in imports.
Price effects played a noticeable role in August, as export volumes were up 3.0 percent and import volumes just 1.2 percent.
Looking at sector breakdowns within exports, metal and energy led the increase. Metal and non-metallic mineral products rose 29.1 percent to a record C$8.5 billion, with the largest contributions coming from unwrought gold, silver, and platinum group metals (up 89.5 percent). Gold asset transfers in the banking sector were behind higher exports of the precious metal to the US over the month. Metal ores and non-metallic minerals were up 14.8 percent, and energy products 14.6 percent. The resumption of port activity in British Columbia supported exports of coal, potash and lumber.
Gains in imports were widespread across 9 of 11 categories. Of note, industrial machinery equipment and parts increased 7.5 percent, an encouraging sign for business investment activity. Elsewhere, basic and industrial chemical, plastic and rubber products increased 11.2 percent, consumer goods 2.2 percent and electronical equipment and parts 3.7 percent. Energy was up 10.4 percent.
Regionally, the surplus with the United States expanded to C$10.4 billion, the largest since June 2022. Canada's merchandise trade deficit with countries other than the United States widened to $9.7 billion from 8.6 billion.
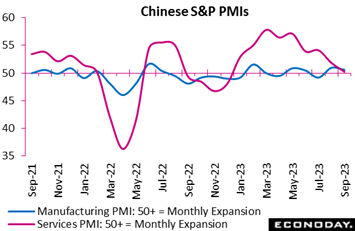 S&P’s services PMI for China fell sharply and unexpectedly from 51.8 in August to 50.2 in September and was nearly 2 points below Econoday’s consensus. Survey respondents reported smaller increases in output and new orders and the survey's measure of confidence fell to a ten-month low. S&P’s measure for the manufacturing sector fell from 51.0 to 50.6, indicating conditions in the sector remain subdued in September. Confidence among this sample fell to a 12-month low. Though government officials have loosened policy settings in recent months, these results suggest their measures have yet to deliver substantial improvement in economic activity. S&P’s services PMI for China fell sharply and unexpectedly from 51.8 in August to 50.2 in September and was nearly 2 points below Econoday’s consensus. Survey respondents reported smaller increases in output and new orders and the survey's measure of confidence fell to a ten-month low. S&P’s measure for the manufacturing sector fell from 51.0 to 50.6, indicating conditions in the sector remain subdued in September. Confidence among this sample fell to a 12-month low. Though government officials have loosened policy settings in recent months, these results suggest their measures have yet to deliver substantial improvement in economic activity.
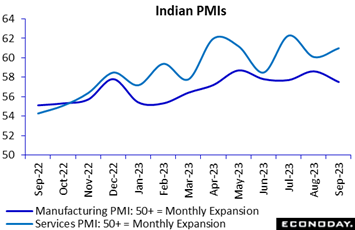 The Bank of India may be firmly on pause, but the Indian economy appears to be growing strongly. India's services PMI improved further in September, increasing to 61.0 from 60.1 in August, its highest level since 2010. The manufacturing sector PMI, also published in the week, is nearly as strong, at 57.5 though down from August’s 58.6. The Bank of India may be firmly on pause, but the Indian economy appears to be growing strongly. India's services PMI improved further in September, increasing to 61.0 from 60.1 in August, its highest level since 2010. The manufacturing sector PMI, also published in the week, is nearly as strong, at 57.5 though down from August’s 58.6.
Respondents to the service sector survey reported output and new orders grew at faster pace in September, while new export orders rose at a pace just below the record set in August. The survey also shows further growth in payrolls while its measure of business confidence rose to its highest level in more than nine years. Respondents reported a sharp slowdown in input cost growth and a smaller increase in selling prices.
Manufacturing respondents reported output, new orders, and new export orders all grew at a slower but still robust pace in September. The survey also shows a bigger increase in payrolls and an increase in its measure of business confidence to its highest level so far this year. Respondents reported a smaller increase in input costs after these had surged in August but a bigger increase in selling prices.
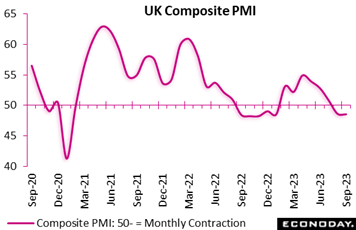 The UK economy contracted by less than originally thought last month. The final composite output index stood at 48.5, up sharply from its 46.8 flash estimate and now just a tick short of August's final 48.6. That said, it was still below the 50-expansion threshold and indicative of the steepest fall in business activity since January. The UK economy contracted by less than originally thought last month. The final composite output index stood at 48.5, up sharply from its 46.8 flash estimate and now just a tick short of August's final 48.6. That said, it was still below the 50-expansion threshold and indicative of the steepest fall in business activity since January.
The headline revision reflected stronger services where the 47.2 flash sector PMI was amended to 49.3, just 0.2 points short of its final August mark and close enough to 50 to signal stagnation. Even so, new business continued to decline marginally as demand softened at home and abroad and backlogs decreased for a fourth straight month. Headcount also fell for the first time in just over two-and-a-half years and at the fastest rate since the start of 2021. Yet business expectations for the year ahead remained optimistic overall, edging up to a 3-month high in September.
Following earlier positive revisions to GDP growth over the first half of the year, economic activity seems to be holding up better than expected. Nevertheless, September's update still suggests the UK economy had a subdued third quarter.
Global data on net are coming in just above consensus estimates, at 12 on Econoday’s Relative Performance Index. North America is driving the results with Canada, after its employment gains, again the greatest outperformer at 47. Hotter-than-expected inflation results are also behind the country’s strength, evident by the 38 score when stripping out prices (RPI-P). The US is trailing a bit at 25 on both the RPI and RPI-P which nevertheless is solid. Policy makers at both the Bank of Canada and Federal Reserve may well be losing patience with their wait-and-see approach; rate hikes at their respective announcements on October 23 and November 1 should come as no surprise.
In Japan, recent updates including household spending and the BoJ’s Tankan survey have lifted the RPI to 26 and the RPI-P to 36. Both measures show that after a disappointingly soft run in September, economic activity in general is beginning to outperform. This should be particularly welcome by policymakers with dollar/yen once again threatening to break above the ¥150 level.
A mixed run of data in the Eurozone leaves this RPI at minus 9, near enough to the zero-line to indicate that economic activity is matching forecasters’ predictions. In the UK, the unusually large upward revision to the September PMI composite was largely responsible for lifting the RPI (34) and RPI-P (33) back above zero. However, overall economic outperformance still masks pockets of weakness, notably in the construction sector where housing remains a real concern.
In Switzerland, the RPI remains just short of zero at minus 4 but is biased down by unexpectedly soft inflation that masks some upside surprises in the real economy data. Hence, at 10, the RPI-P shows a limited degree of outperformance. The bottom line is that the Swiss National Bank should be quite happy with its current policy stance.
**Contributing to this article were Jeremy Hawkins, Brian Jackson, Laurie Laird, Mace News, Max Sato, and Theresa Sheehan
After the surprisingly strong September employment report, the outlook for Federal Reserve policy will no doubt preoccupy the global markets. First up will be FOMC minutes on Wednesday tracking the debate on last month’s no-action decision. Second and more substantially will be September consumer prices on Thursday where forecasters are looking for some (but not very much) fundamental improvement. Minutes from the European Central Bank’s meeting in September when, by contrast to the Fed, rates were hiked will be posted on Thursday just before the US CPI release.
Key Chinese data will be posted Friday including merchandise trade, where a rising surplus is expected, as well consumer prices where flat results are the call. Consumer prices from India on Thursday are expected to show slowing from highly elevated levels. Other data to watch include German industrial production on Monday, Japanese machinery orders on Thursday, and monthly GDP from the UK also on Thursday where marginal growth is the consensus.
German Industrial Production for August (Mon 0600 GMT; Mon 0800 CEST; Mon 0200 EDT)
Consensus Forecast, Month over Month: -0.1%
Consensus Forecast, Year over Year: -1.6%
After three straight declines for the first time since April-June 2021, industrial production in August is expected to fall further but only marginally, by 0.1 percent. The year-over-year comparison is seen falling 1.6 percent following July’s 2.2 percent decrease.
Japanese Machinery Orders for August (Wed 2350 GMT; Thu 0850 JST; Wed 1950 EDT)
Consensus Forecast, Month over Month: 0.1%
Consensus Forecast, Year over Year: -6.1%
Machinery orders are expected to edge 0.1 percent higher in August for year-over-year contraction of 6.1 percent. Orders in July fell 1.1 percent on the month and 13.0 percent on the year. The government’s assessment in the July report repeated that machinery orders were “pausing”.
UK Industrial Production for August (Thu 0600 GMT; Thu 0700 BST; Thu 0200 EDT)
Consensus Forecast, Month over Month: -0.2%
Consensus Forecast, Year-over-Year: 0.8%
Manufacturing Output
Consensus Forecast, Month over Month: -0.3%
Industrial production is expected to fall 0.2 percent in August following a 0.7 percent decline in July that reversed only a portion of June’s 1.8 percent surge. Manufacturing output, which fell 0.8 percent in July but jumped 2.4 percent in June, is expected to fall 0.3 percent.
UK GDP for August (Thu 0600 GMT; Thu 0700 BST; Thu 0200 EDT)
Consensus Forecast, Month over Month: 0.2%
GDP in the month of August is expected to rebound 0.2 percent versus 0.5 percent contraction in July which was much weaker than expected.
Indian CPI for September (Thu 1200 GMT; Thu 1730 IST; Thu 0800 EDT)
Consensus Forecast, Year over Year: 5.70%
Consumer prices are expected to ease back to 5.70 percent on the year in September versus August’s 6.83 percent and following July’s weather-driven spike in food prices to 7.44 percent.
Indian Industrial Production for August (Tue 1200 GMT; Tue 1730 IST; Tue 0800 EDT)
Consensus Forecast, Year over Year: 9.3%
Year-over-year industrial production growth is expected to rise to 9.3 percent in August versus growth of 5.7 percent in July.
US CPI for September (Thu 1230 GMT; Thu 0830 EDT)
Consensus Forecast, Month over Month: 0.3%
Consensus Forecast, Year over Year: 3.6%
US CPI Core, Less Food & Energy
Consensus Forecast, Month over Month: 0.3%
Consensus Forecast, Year over Year: 4.1 %
Core prices in September are expected to hold steady at a monthly increase of 0.3 percent to match August’s 0.3 percent increase which was 1 tenth over Econoday’s consensus. Overall prices are also expected to rise 0.3 percent after August’s as-expected percent 0.6 increase which hit expectations. Annual rates, at 3.7 percent overall and 4.3 percent for the core in August, are expected 3.6 at 4.1 percent respectively.
Chinese Merchandise Trade Balance for September (Estimated for Friday, release time not set)
Consensus Forecast: US$70.50 billion
Consensus Forecast: Imports - Y/Y: -5.5%
Consensus Forecast: Exports - Y/Y: -7.5%
China's trade surplus for September is expected to widen to US$70.50 billion versus August’s lower-than-expected US$68.36 billion.
Chinese CPI for September (Fri 0130 GMT; Fri 0930 CST; Thu 2130 EDT)
Consensus Forecast, Month over Month: 0.3%
Consensus Forecast, Year over Year: 0.2%
After August’s nearly as-expected 0.1 percent year-over-year rate, September is expected to edge up to a nearly as microscopic 0.2 percent. China’s CPI last peaked in January at 2.1 percent.
Chinese PPI for September (Fri 0130 GMT; Fri 0930 CST; Thu 2130 EDT)
Consensus Forecast, Year over Year: -2.4%
Producer prices have been in annual contraction the last eleven reports. September’s consensus is minus 2.4 percent on the year versus a nearly as expected minus 3.0 percent in August.
Eurozone Industrial Production for August (Fri 0900 GMT; Fri 1100 CEST; Fri 0500 EDT)
Consensus Forecast, Month over Month: 0.0%
Consensus Forecast, Year over Year: -3.0%
Production in August is expected to come in unchanged after falling 1.1 percent in July. Consensus for August’s year-over-year rate is contraction of 3.0 percent versus July contraction of 2.2 percent.
US Consumer Sentiment Index, Preliminary October (Fri 1400 GMT; Fri 1000 EDT)
Consensus Forecast: 67.5
Consumer sentiment in the first indication for October, which in September fell 1.4 points to 68.1, is expected fall further to 67.5.
|
