|
Recovery isn't picking up much momentum yet, especially in China where the latest economic data slowed more than expected. Otherwise, global numbers are hitting expectations pretty squarely, mixed between flat readings on supply and demand but elevated ones for inflation. Yet however high inflation is moving, "transitory" is still the official hypothesis and, along with the still uncertain Covid outlook, look to freeze global monetary policy in place. Well almost in place.
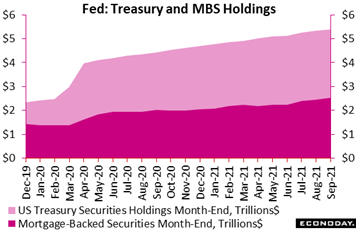 Until US payroll data shook up the prospect of “further substantial” improvement in the labor market, expectations were that the Fed would announce – or maybe announce – a tapering in its $120 billion per month of asset purchases (split between $80 billion Treasuries, $40 billion MBS). Jerome Powell’s speech to the virtual Jackson Hole Forum on August 27 had certainly signaled that things were moving in that direction. But the subsequent 235,000 rise in August nonfarm payrolls after the 1.053 million in July certainly was a shock, especially measured against expectations for something over 700,000. Yet FOMC members may nonetheless conclude that job growth meets their criteria for sufficient improvement. Gains for the third quarter to date are averaging 644,000 jobs a month, a faster pace than the 615,000 in the second quarter and 518,000 in the first. Fed policymakers may also take into account the strength of business formation that could be indicating potential workers – with desirable skills – are hanging out their own shingles rather than accepting employment at someone else’s company. And then there’s the expiration of emergency unemployment benefits and the winding down of the child-tax credit refund in a few weeks, which could encourage those without a job to get back in the labor market. On the other hand, the surge in Covid infections and resistance of the unvaccinated to getting inoculated are definitely not positives for the US outlook. How much weight policymakers will give to these worries should be visible in the Summary of Economic Projections and whether these quarterly projections are lifted at their meeting on Tuesday and Wednesday. This is the sort of moment when dissent may emerge from within the FOMC. If it does, when to scale back asset purchases could be the point of departure. Until US payroll data shook up the prospect of “further substantial” improvement in the labor market, expectations were that the Fed would announce – or maybe announce – a tapering in its $120 billion per month of asset purchases (split between $80 billion Treasuries, $40 billion MBS). Jerome Powell’s speech to the virtual Jackson Hole Forum on August 27 had certainly signaled that things were moving in that direction. But the subsequent 235,000 rise in August nonfarm payrolls after the 1.053 million in July certainly was a shock, especially measured against expectations for something over 700,000. Yet FOMC members may nonetheless conclude that job growth meets their criteria for sufficient improvement. Gains for the third quarter to date are averaging 644,000 jobs a month, a faster pace than the 615,000 in the second quarter and 518,000 in the first. Fed policymakers may also take into account the strength of business formation that could be indicating potential workers – with desirable skills – are hanging out their own shingles rather than accepting employment at someone else’s company. And then there’s the expiration of emergency unemployment benefits and the winding down of the child-tax credit refund in a few weeks, which could encourage those without a job to get back in the labor market. On the other hand, the surge in Covid infections and resistance of the unvaccinated to getting inoculated are definitely not positives for the US outlook. How much weight policymakers will give to these worries should be visible in the Summary of Economic Projections and whether these quarterly projections are lifted at their meeting on Tuesday and Wednesday. This is the sort of moment when dissent may emerge from within the FOMC. If it does, when to scale back asset purchases could be the point of departure.
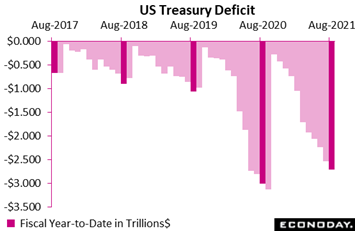 However much the Fed's balance sheet continues to climb, tapering is already underway when it comes to US fiscal policy. The Treasury budget deficit in August came in at $170.6 billion, nearly half of Econoday's consensus and 15 percent less than the shortfall in the same month last year. The Treasury's deficit 11 months into fiscal 2021 totals $2.711 trillion, roughly 10 percent smaller than last year's shortfall. Outlays, which were up a year-to-date 46 percent this time last year, are up only 4 percent so far this year, to $6.297 trillion that, however, more than offsets an 18 percent increase in receipts to $3.586 trillion. Leading the 11-month increase in receipts are individual taxes, up 26 percent to $1.830 trillion. And a larger proportional increase on the receipts side is a 76 percent jump in corporate income taxes to $285.1 billion. The rise on the outlay side of the balance sheet is largely the result of a 32 percent increase in income security payments to $1.569 trillion, followed by a 55 percent rise in general government expenses to $262.6 billion, which are partly offset by a 44 percent decline in commerce and housing credit to $321.5 billion and an 11 percent decrease in Medicare expenditures to $636.8 billion. However much the Fed's balance sheet continues to climb, tapering is already underway when it comes to US fiscal policy. The Treasury budget deficit in August came in at $170.6 billion, nearly half of Econoday's consensus and 15 percent less than the shortfall in the same month last year. The Treasury's deficit 11 months into fiscal 2021 totals $2.711 trillion, roughly 10 percent smaller than last year's shortfall. Outlays, which were up a year-to-date 46 percent this time last year, are up only 4 percent so far this year, to $6.297 trillion that, however, more than offsets an 18 percent increase in receipts to $3.586 trillion. Leading the 11-month increase in receipts are individual taxes, up 26 percent to $1.830 trillion. And a larger proportional increase on the receipts side is a 76 percent jump in corporate income taxes to $285.1 billion. The rise on the outlay side of the balance sheet is largely the result of a 32 percent increase in income security payments to $1.569 trillion, followed by a 55 percent rise in general government expenses to $262.6 billion, which are partly offset by a 44 percent decline in commerce and housing credit to $321.5 billion and an 11 percent decrease in Medicare expenditures to $636.8 billion.
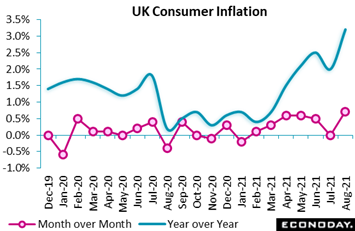 Consumer prices in the UK were unexpectedly heated in August. A 0.7 percent monthly jump well exceeded Econoday's consensus while annual inflation jumped from 2.0 percent to 3.2 percent, the latter comparison inflated by last year's Eat Out to Help Out scheme and a cut in value-added taxes. This was the steepest increase in the annual rate on record and means that inflation is now at its highest level since March 2012 and is also 1.2 percentage points above target. Core prices showed similar pressure, up 0.7 percent on the month and 3.1 percent on the year. Last month's Monetary Policy Report from the Bank of England (which meets in the coming week) showed headline inflation rising to 4 percent in the fourth quarter, so August's jump need not have any immediate implications for monetary policy. One-off factors clearly played a key role in the acceleration and the central bank will look through these when deciding what to do next. Still, the record rises in both the headline and core rates raise the risk of knock-on effects on inflation expectations at a time when annual wage growth is already over 8 percent. No doubt BoE hawks are becoming increasingly anxious. Consumer prices in the UK were unexpectedly heated in August. A 0.7 percent monthly jump well exceeded Econoday's consensus while annual inflation jumped from 2.0 percent to 3.2 percent, the latter comparison inflated by last year's Eat Out to Help Out scheme and a cut in value-added taxes. This was the steepest increase in the annual rate on record and means that inflation is now at its highest level since March 2012 and is also 1.2 percentage points above target. Core prices showed similar pressure, up 0.7 percent on the month and 3.1 percent on the year. Last month's Monetary Policy Report from the Bank of England (which meets in the coming week) showed headline inflation rising to 4 percent in the fourth quarter, so August's jump need not have any immediate implications for monetary policy. One-off factors clearly played a key role in the acceleration and the central bank will look through these when deciding what to do next. Still, the record rises in both the headline and core rates raise the risk of knock-on effects on inflation expectations at a time when annual wage growth is already over 8 percent. No doubt BoE hawks are becoming increasingly anxious.
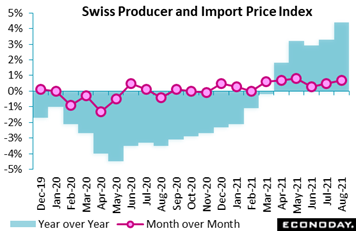 Other CPI news was mixed in the week, with core prices slowing in the US and Canada but accelerating in the Eurozone. Prices at the base of the supply chain remain elevated just about everywhere you look including Switzerland whose combined producer and import price index rose for a sixth straight month. August's 0.7 percent advance was more than double the consensus and boosted annual inflation from 3.3 percent to 4.4 percent, a multi-year high. Domestic producer prices climbed a further 0.5 percent on the month, raising yearly PPI inflation from 2.1 percent to 2.9 percent. Import prices were up a sharper 1.0 percent, lifting their annual rate from 5.9 percent to 7.6 percent. Though pressure was centered in petroleum and chemicals, the report's underlying core rate also showed pressure, up 0.7 percent on the month to double the annual rate to 2.2 percent, some 4.4 percentage points above its August 2020 low. The Swiss National Bank also meets in the coming week though for this central bank, currency values, less inflation, is of the highest concern. Other CPI news was mixed in the week, with core prices slowing in the US and Canada but accelerating in the Eurozone. Prices at the base of the supply chain remain elevated just about everywhere you look including Switzerland whose combined producer and import price index rose for a sixth straight month. August's 0.7 percent advance was more than double the consensus and boosted annual inflation from 3.3 percent to 4.4 percent, a multi-year high. Domestic producer prices climbed a further 0.5 percent on the month, raising yearly PPI inflation from 2.1 percent to 2.9 percent. Import prices were up a sharper 1.0 percent, lifting their annual rate from 5.9 percent to 7.6 percent. Though pressure was centered in petroleum and chemicals, the report's underlying core rate also showed pressure, up 0.7 percent on the month to double the annual rate to 2.2 percent, some 4.4 percentage points above its August 2020 low. The Swiss National Bank also meets in the coming week though for this central bank, currency values, less inflation, is of the highest concern.
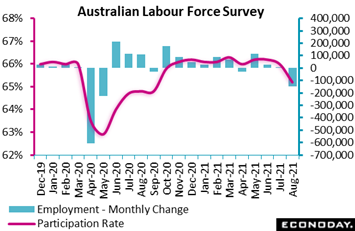 The Reserve Bank of Australia's next meeting is early next month, and August's labour market data are certain to be a concern. Both employment and participation, reflecting Covid restrictions, fell sharply in August. The country's unemployment rate did edge 1 tenth lower to 4.5 percent, but this was largely driven by an exit from the labour force as the participation rate slumped noticeably from 66.0 percent to 65.2 percent, its lowest level since September 2020. The survey's measure of under-employment rose from 8.3 percent in July to 9.3 percent in August. The number of employed persons in Australia fell by 146,300 in August after increasing 2,200 in July for the biggest drop since May 2020. Full-time employment fell by 68,000 while part-time employment fell 78,200; total hours worked fell by 3.7 percent. At their meeting earlier this month, the RBA noted that economic recovery would likely be delayed by the impact of public health restrictions. Nevertheless, officials expressed confidence that conditions would improve quickly once restrictions are eased. Note that Australia's two most populous states, New South Wales and Victoria, were both in lockdown throughout August, though restrictions for the vacinnated in the former state have since been eased. The Reserve Bank of Australia's next meeting is early next month, and August's labour market data are certain to be a concern. Both employment and participation, reflecting Covid restrictions, fell sharply in August. The country's unemployment rate did edge 1 tenth lower to 4.5 percent, but this was largely driven by an exit from the labour force as the participation rate slumped noticeably from 66.0 percent to 65.2 percent, its lowest level since September 2020. The survey's measure of under-employment rose from 8.3 percent in July to 9.3 percent in August. The number of employed persons in Australia fell by 146,300 in August after increasing 2,200 in July for the biggest drop since May 2020. Full-time employment fell by 68,000 while part-time employment fell 78,200; total hours worked fell by 3.7 percent. At their meeting earlier this month, the RBA noted that economic recovery would likely be delayed by the impact of public health restrictions. Nevertheless, officials expressed confidence that conditions would improve quickly once restrictions are eased. Note that Australia's two most populous states, New South Wales and Victoria, were both in lockdown throughout August, though restrictions for the vacinnated in the former state have since been eased.
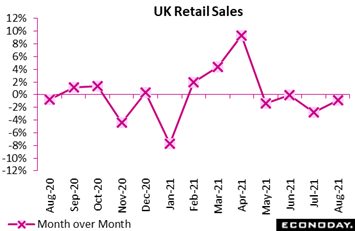 One of the unwanted themes of global data has been weakness in consumer spending, the result of public-health issues that are still evident in the UK, a country at the very forefront of the fight against Covid. Retail sales fell again and unexpectedly in August, down 0.9 percent on the month following a steeper revised 2.9 percent decline in July. Volumes have now decreased for four months in a row. Annual growth slowed from 1.9 percent to zero percent and purchases are now only 4.6 percent above their pre-pandemic level in February last year. Excluding auto fuel, the picture was even weaker with sales sliding a monthly 1.2 percent to stand 0.9 percent lower on the year. In line with July, the overall monthly drop was broad-based: non-food down 1.2 percent within which non-specialised stores, down 3.7 percent, were especially soft; non-store retailing and food were both down with the only gains in textiles and clothing, up 0.7 percent, and auto fuel at 1.5 percent. Meantime, inflation accelerated significantly with the total sales deflator accelerating from a 2.8 percent annual rate to 3.5 percent and its non-auto fuel counterpart from 1.6 percent to 2.3 percent. Both are multi-year highs. The latter are a reminder that concerns over rising prices, along with Covid restrictions, may also be holding back consumer spending. August's data put average third-quarter volumes 3.8 percent below their mean level in the second quarter meaning, absent of any revisions, September will need a monthly bounce of at least 12.3 percent if the sector is not to subtract from third-quarter GDP. One of the unwanted themes of global data has been weakness in consumer spending, the result of public-health issues that are still evident in the UK, a country at the very forefront of the fight against Covid. Retail sales fell again and unexpectedly in August, down 0.9 percent on the month following a steeper revised 2.9 percent decline in July. Volumes have now decreased for four months in a row. Annual growth slowed from 1.9 percent to zero percent and purchases are now only 4.6 percent above their pre-pandemic level in February last year. Excluding auto fuel, the picture was even weaker with sales sliding a monthly 1.2 percent to stand 0.9 percent lower on the year. In line with July, the overall monthly drop was broad-based: non-food down 1.2 percent within which non-specialised stores, down 3.7 percent, were especially soft; non-store retailing and food were both down with the only gains in textiles and clothing, up 0.7 percent, and auto fuel at 1.5 percent. Meantime, inflation accelerated significantly with the total sales deflator accelerating from a 2.8 percent annual rate to 3.5 percent and its non-auto fuel counterpart from 1.6 percent to 2.3 percent. Both are multi-year highs. The latter are a reminder that concerns over rising prices, along with Covid restrictions, may also be holding back consumer spending. August's data put average third-quarter volumes 3.8 percent below their mean level in the second quarter meaning, absent of any revisions, September will need a monthly bounce of at least 12.3 percent if the sector is not to subtract from third-quarter GDP.
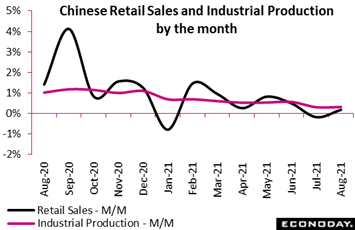 We saved the worst news for last, that is the latest from China. Retail sales did rise 0.17 percent on the month in August, which was up from 0.19 percent contraction in July, but the annual rate slowed a full 6 percentage points to 2.5 percent which was far below expectations for 7.1 percent. Weakness was broad-based including auto sales, down 7.4 percent on the year, and communications equipment, down 14.9 percent; sales in rural and especially unban areas both weakened. Note, however, that annual rates are skewed by 2020 Covid effects that grossly inflated gains earlier this year and have in turn distorted the subsequent degree of slowing. Nevertheless, month-over-month change, where last year's Covid effects are excluded, are also on a slowing trend as tracked in the accompanying graph. Chinese industrial production was another disappointment in August, up 5.3 percent on the year versus 6.4 percent in July and below the consensus forecast for an increase of 5.8 percent. On the month, production rose 0.31 percent, little changed from July's 0.30 percent. Annual rates of output for autos, chemicals, general equipment, and textiles all slowed in August, weakness echoed in separate August data on fixed investment where growth also failed to meet expectations. We saved the worst news for last, that is the latest from China. Retail sales did rise 0.17 percent on the month in August, which was up from 0.19 percent contraction in July, but the annual rate slowed a full 6 percentage points to 2.5 percent which was far below expectations for 7.1 percent. Weakness was broad-based including auto sales, down 7.4 percent on the year, and communications equipment, down 14.9 percent; sales in rural and especially unban areas both weakened. Note, however, that annual rates are skewed by 2020 Covid effects that grossly inflated gains earlier this year and have in turn distorted the subsequent degree of slowing. Nevertheless, month-over-month change, where last year's Covid effects are excluded, are also on a slowing trend as tracked in the accompanying graph. Chinese industrial production was another disappointment in August, up 5.3 percent on the year versus 6.4 percent in July and below the consensus forecast for an increase of 5.8 percent. On the month, production rose 0.31 percent, little changed from July's 0.30 percent. Annual rates of output for autos, chemicals, general equipment, and textiles all slowed in August, weakness echoed in separate August data on fixed investment where growth also failed to meet expectations.
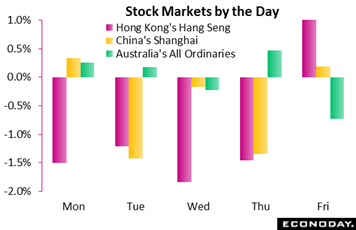 Another salvo in China's regulatory crackdown, including threats to break up Alibaba's Alipay unit, swept Hong Kong's Hang Seng down 1.5 percent on Monday. Then on Tuesday Evergrande began to hit Chinese markets hard after the property developer warned that its cash position was worsening. Evergrande's bonds were pricing in a likely default, raising deeper questions over cascading sell-offs, systemic risks, and government bailouts. Then on Wednesday an August batch of Chinese data, especially retail sales, focused concerns on nuts-and-bolts fundamentals and just how fast the country's economy is fading. Recovery hopes did get a lift at mid-week from Australia, on the country's flattening Covid trend and an announcement from Qantas that, after nearly two years, it would resume overseas flights, news that would help offset disappointment over the country's weak labour survey. Thursday saw Chinese property and banking stocks extending their sell-off as Evergrande fell another 6.4 percent and then another 3.4 percent on Friday as the troubled firm struggled to stay current on its debt. Another salvo in China's regulatory crackdown, including threats to break up Alibaba's Alipay unit, swept Hong Kong's Hang Seng down 1.5 percent on Monday. Then on Tuesday Evergrande began to hit Chinese markets hard after the property developer warned that its cash position was worsening. Evergrande's bonds were pricing in a likely default, raising deeper questions over cascading sell-offs, systemic risks, and government bailouts. Then on Wednesday an August batch of Chinese data, especially retail sales, focused concerns on nuts-and-bolts fundamentals and just how fast the country's economy is fading. Recovery hopes did get a lift at mid-week from Australia, on the country's flattening Covid trend and an announcement from Qantas that, after nearly two years, it would resume overseas flights, news that would help offset disappointment over the country's weak labour survey. Thursday saw Chinese property and banking stocks extending their sell-off as Evergrande fell another 6.4 percent and then another 3.4 percent on Friday as the troubled firm struggled to stay current on its debt.
With China the negative outlier, Econoday's consensus divergence indexes are largely clustered close to the zero line to indicate that economists are accurately forecasting economic results: whether the UK and Canada at plus 10, the Eurozone at plus 7, Switzerland at plus 3, or the US at minus 4. Beating expectations by a tangible degree are Italy at plus 20 and France at plus 23. But it must be stressed that there's a visible separation underway within the global data: supply and demand are subdued while inflationary pressures are elevated.
**Contributing to this article were Jeremy Hawkins, Brian Jackson, Mace News, Max Sato, and Theresa Sheehan
Five major policy announcements but expectations, perhaps, of a change for only one: the Federal Reserve and whether it begins to unfold plans for reducing asset purchases. That will be on Wednesday preceded by China's loan prime rate announcement on Tuesday and an announcement by the Bank of Japan, expected earlier Wednesday. Policy announcements will follow on Thursday, first from the Swiss National Bank then the Bank of England. Flash PMIs for the month of September will be posted on Thursday, first for Japan, then France, Germany, the UK and the US. Substantial strength for manufacturing is the general expectation, and moderate strength for services. Japan will head the week's inflation data with the CPI on Friday preceded by Germany's PPI that will open the week's calendar on Monday. Sentiment data will be heavy in the week led off by the EC consumer confidence flash on Wednesday followed later in the week by business sentiment from France and Germany and business and consumer sentiment from Italy. Canadian retail sales and US jobless claims will be reports to watch on Thursday as will the latest on the US housing sector: housing starts and permits on Tuesday and new home sales on Friday.
German PPI for August (Mon 6:00 GMT; Mon 08:00 CEST; Mon 02:00 EDT)
Consensus Forecast, Month over Month: 0.9%
Consensus Forecast, Year over Year: 10.9%
At 1.9 percent on the month, producer prices were much stronger than the market consensus in July, and the annual rate, up nearly 2 percentage points to 10.4 percent, was the highest since 1975. August's monthly rate is seen up a very sizable 0.9 percent with the annual rate heating further to 10.9 percent.
China Loan Prime Rate (Tuesday, Release Time Not Set)
Consensus Change: 0 basis points
Consensus Level: 3.85%
The People's Bank of China is not expected to change its one-year loan prime rate at 3.85 percent.
US Housing Starts for August (Tue 12:30 GMT; Tue 08:30 EDT)
Consensus Forecast, Annual Rate: 1.575 million
US Building Permits
Consensus Forecast: 1.610 million
A 1.575 million annual is expected for August starts versus July's lower-than-expected 1.534 million rate. Permits, which in contrast to starts beat expectations in July, are seen at 1.610 million versus 1.630 million (revised from July's initial 1.635 million).
Bank of Japan Announcement (Anytime Wednesday)
Consensus Forecast, Change: 0 basis points
Consensus Forecast, Level: -0.10%
The Bank of Japan is committed to aggressive stimulus and since early 2016 has kept its policy rate unchanged at minus 0.10 percent. Officials in their last statement in July reaffirmed their commitment that monetary policy will remain highly accommodative until inflation reaches and then stabilizes above their 2.0 percent target level.
Eurozone: EC Consumer Confidence Flash for September (Wed 14:00 GMT; Wed 16:00 CEST; Wed 10:00 EDT)
Consensus Forecast: -5.5
Consumer confidence has deteriorated the last two reports, to minus 5.3 in August. The consensus for September is minus 5.5.
US Federal Reserve Announcement (Wed 18:00 GMT; Wed 14:00 EDT)
Consensus Forecast, Change: 0 basis points
Consensus Forecast, Policy Range: 0.0% to 0.25%
However disappointing the August employment was, Fedspeak has been hawkish and there are tangible expectations that tapering (the slowing of asset purchases) will be directly addressed. There are no expectations for a change in rate policy.
French Business Climate Indicator for September (Thu 06:45 GMT; Thu 08:45 CEST; Thu 02:45 EDT)
Consensus Forecast, Manufacturing: 110
Reflecting strength in past output and personal-production expectations that offset deterioration in business sentiment, France's business climate indicator managed a 1 point gain to 110 in August. September's expectation is a steady showing at the 110 level.
French PMI Flashes for September (Thu 07:15 GMT; Thu 09:15 CEST; Thu 03:15 EDT)
Consensus Forecast, Manufacturing: 57.0
Consensus Forecast, Services: 56.2
France's PMIs have been slowing but were still solid in the mid-to-high 50s in August. September's forecasts are 57.0 for manufacturing and 56.2 for services.
German PMI Flashes for September (Thu 07:30 GMT; Thu 09:30 CEST; Thu 03:30 EDT)
Consensus Forecast, Manufacturing: 61.5
Consensus Forecast, Services: 60.4
Very strong growth but a little closer to the 60 line is expected for September, both for manufacturing where the consensus is 61.5 versus August's final at 62.6 and services, seen at 60.4 versus 60.8.
Swiss National Bank Monetary Policy Assessment (Thu 07:30 GMT; Thu 09:30 CEST; Thu 03:30 EDT)
Consensus Forecast, Change: 0.0 basis points
Consensus Forecast, Level: -0.75%
Given stability in the Swiss franc, the Swiss National Bank is expected to hold its key deposit rate unchanged at minus 0.75 percent.
UK PMI Flashes for September (Thu 08:30 GMT; Thu 09:30 BST; Thu 04:30 EDT)
Consensus Forecast, Manufacturing: 59.6
Consensus Forecast, Services: 55.1
The services PMI slowed quite sharply and by significantly more than expected in August, down from the high 50s to 55.0 for the month's final reading. For September's flash, the services consensus is a steady showing at 55.1 with manufacturing, which has been very strong, seen edging a bit below the 60 line to 59.6.
Bank of England Announcement (Thu 11:00 GMT; Thu 12:00 BST; Thu 07:00 EDT)
Consensus Forecast, Change: 0 basis points
Consensus Forecast, Level: 0.10%
Consensus Forecast: Asset Purchase Level: £895 billion
Despite hawkish comments from policymakers, the Bank of England is expected to hold policy steady, at 0.10 percent for Bank Rate and £895 billion (gilts accounting for £875 billion) for QE.
US Initial Jobless Claims for the September 18 week (Thu 12:30 GMT; Thu 08:30 EDT)
Consensus Forecast: 309,000
Jobless claims for the September 18 week (also the sample week for the monthly employment report) are expected to come in at 309,000 versus 332,000 in the prior week and 349,000 in the sample week for the August employment report.
Canadian Retail Sales for July (Thu 12:30 GMT; Thu 08:30 EDT)
Consensus Forecast, Month over Month: 2.9%
After sharp back-to-back declines, retail sales in June rebounded 4.2 percent in June which, however, was 6 tenths less than expected. Sales in July are expected to rise 2.9 percent.
US PMI Flashes for September (Thu 13:45 GMT; Thu 09:45 EDT)
Consensus Forecast, Manufacturing: 60.8
Consensus Forecast, Services: 55.1
Growth rates in the PMIs were mixed in August, in the 60s for manufacturing but slowing to the mid-50s for services. September's respective expectations are steady showings at 60.8 and 55.1.
Japanese Consumer Price Index for August (Thu 23:30 GMT; Fri 08:30 JST; Thu 19:30 EDT)
Consensus Forecast, Year over Year: -0.3%
Consensus Forecast Ex-Fresh Food, Year over Year: -0.2%
Price pressures fell back in July and aren't expected to improve in August, seen steady at annual contraction of 0.3 percent overall and steady at contraction of 0.2 percent excluding fresh food.
Japanese PMI Flashes for September (Fri 00:30 GMT; Fri 09:30 JST; Thu 20:30 EDT)
Consensus Forecast, Manufacturing: 52.0
Consensus Forecast, Services: 43.0
Hit hard by Covid restrictions, Japan's services PMI broke sharply lower in August, falling 4-1/2 points to a deeply contractionary 42.9 (revised lower from 43.5 flash). Manufacturing, however, held up well, slowing only slightly to a modestly expansionary level of 52.4 (52.7 flash). Expectations for September's flashes are no improvement for services at 43.0 and another month of slight slowing for manufacturing to 52.0.
German Ifo Business Climate Indicator for September (Fri 08:00 GMT; Fri 10:00 CEST; Fri 04:00 EDT)
Consensus Forecast: 99.0
September's market consensus is a 4 tenths decline to 99.0 for Ifo's business climate indicator which has fallen a combined 2.3 points in the last two reports.
Italian Business and Consumer Confidence for September (Fri 08:00 GMT; Fri 10:00 CEST; Fri 04:00 EDT)
Consensus Forecast, Manufacturing Confidence: 114.9
Consensus Forecast, Consumer Confidence: 115.5
Confidence eased back in August with September seen mixed: a bounce higher to 114.9 expected for manufacturing confidence, which would be a 1.5 point gain, and a dip to 115.5 for consumer confidence which would be a 7 tenths decline.
US New Home Sales for August (Fri 14:00 GMT; Fri 10:00 EDT)
Consensus Forecast, Annual Rate: 708,000
Sales of new homes have slowed but held quite strong in July, at an annual pace of 708,000. Sales for August are seen holding at the 708,000 rate.
|
