|
Good news was mixed with the bad in the latest week. On net, economic data are coming in below expectations, particularly in China where underperformance may begin to threaten growth forecasts. Covid's unrelenting impact is the greatest challenge facing the global economy followed by stubborn shortages of materials and, at least in the US, available labor. One factor not holding anything back is central-bank policy which, for now, is holding at full throttle.
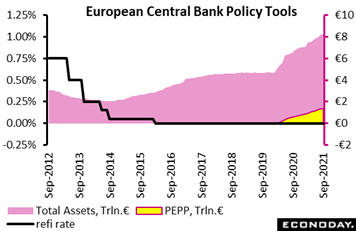 At most the ECB only tinkered with policy at its September meeting. There was no move on key interest rates including the refi rate which was held at zero percent, nor on forward guidance which calls for rates to remain at their present or lower levels until inflation reaches and stabilizes at 2 percent (transitory overshoot allowed). And though there were no adjustments to the longstanding asset purchase programme (APP) where the buying rate stays at €20 billion a month, the central bank did signal that it would be tapering purchases made under its pandemic emergency purchase programme (PEPP), where holdings now total €1.342 trillion. Without mentioning exact amounts, the ECB said monthly purchases will be conducted at a "moderately lower pace than in the previous two quarters." The reduction would seem at most to only reverse the "significantly higher pace" (by roughly €20 billion) introduced at the March meeting when the ECB was concerned about the then rising trend in sovereign bond yields. Indeed, if anything, the language suggests that the cut in the buying rate might be even less. At most the ECB only tinkered with policy at its September meeting. There was no move on key interest rates including the refi rate which was held at zero percent, nor on forward guidance which calls for rates to remain at their present or lower levels until inflation reaches and stabilizes at 2 percent (transitory overshoot allowed). And though there were no adjustments to the longstanding asset purchase programme (APP) where the buying rate stays at €20 billion a month, the central bank did signal that it would be tapering purchases made under its pandemic emergency purchase programme (PEPP), where holdings now total €1.342 trillion. Without mentioning exact amounts, the ECB said monthly purchases will be conducted at a "moderately lower pace than in the previous two quarters." The reduction would seem at most to only reverse the "significantly higher pace" (by roughly €20 billion) introduced at the March meeting when the ECB was concerned about the then rising trend in sovereign bond yields. Indeed, if anything, the language suggests that the cut in the buying rate might be even less.
In reality, the adjustment is not particularly significant and should certainly not be seen as a tightening. The ECB will still be pumping billions of euros into financial markets every month and, crucially, the overall size of the PEPP is unrevised at €1.850 trillion. The termination of the programme remains March 2022 (at the earliest) and reinvestment of the principal payments from maturing securities purchased will continue until at least to the end of 2023. There was no comment on what might happen to the PEPP beyond next March.
Still, the fact that a tapering is being introduced may be seen as evidence that the central bank has become a little more confident about the economic outlook. Justification for the taper was provided in the ECB's updated economic forecasts which nudged up the HICP inflation profile, now at 2.2 percent this year, 1.7 percent next year and 1.5 percent in 2023. However, the medium-term call is still soft and below target and the underlying rate is only seen creeping up to 1.5 percent by the end of 2023.
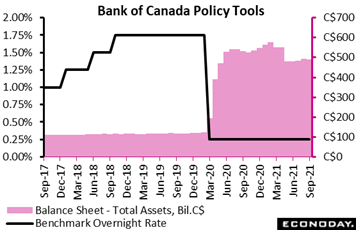 The Bank of Canada has been less dovish than the ECB, beginning its tapering at the turn of the year. But with GDP having stalled (down at an annual 1.1 percent rate in second-quarter data released last week), the BoC said "extraordinary monetary policy support" is still needed, holding its policy rate unchanged at 0.25 percent and maintaining the pace of weekly asset purchases at C$2 billion after reducing it from C$3 billion in its last policy decision on July 14. No action was no surprise especially ahead of Canada's general election on September 20. Though the central bank cited ongoing momentum (confirmed later in the week by solid gains in the August labour force survey), policymakers warned that supply chain disruptions are restraining activity in some sectors and that rising Covid cases pose a risk to the global recovery. Officials have made it clear that they won't raise rates until economic slack is absorbed and stable 2 percent inflation is anchored, which in its July projections the bank saw happening "sometime in the second half of 2022." The focus for the BoC's next meeting on October 27 is whether the bank, which will issue its quarterly monetary policy report, will lower its GDP forecast. In its July report, the BOC projected Canada's economic growth at 6 percent in 2021, 4.5 percent in 2022 and 3.25 percent in 2023. The Bank of Canada has been less dovish than the ECB, beginning its tapering at the turn of the year. But with GDP having stalled (down at an annual 1.1 percent rate in second-quarter data released last week), the BoC said "extraordinary monetary policy support" is still needed, holding its policy rate unchanged at 0.25 percent and maintaining the pace of weekly asset purchases at C$2 billion after reducing it from C$3 billion in its last policy decision on July 14. No action was no surprise especially ahead of Canada's general election on September 20. Though the central bank cited ongoing momentum (confirmed later in the week by solid gains in the August labour force survey), policymakers warned that supply chain disruptions are restraining activity in some sectors and that rising Covid cases pose a risk to the global recovery. Officials have made it clear that they won't raise rates until economic slack is absorbed and stable 2 percent inflation is anchored, which in its July projections the bank saw happening "sometime in the second half of 2022." The focus for the BoC's next meeting on October 27 is whether the bank, which will issue its quarterly monetary policy report, will lower its GDP forecast. In its July report, the BOC projected Canada's economic growth at 6 percent in 2021, 4.5 percent in 2022 and 3.25 percent in 2023.
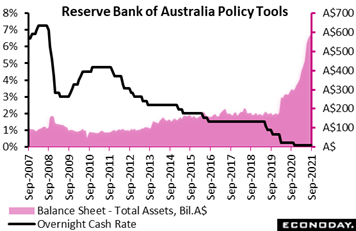 Like the ECB and BoC, the Reserve Bank of Australia reaffirmed its commitment to keep policy highly accommodative to support economic recovery, keeping its main policy rate unchanged at a record low of 0.10 percent as expected. Citing Covid disruptions to the economy and uncertainty over the near-term outlook, the RBA said it will hold its bond purchases at A$4 billion per week at least until mid-February; the bank scaled back its purchases from $A5 billion per week at the beginning of the month. The bank noted that Australia's recovery, which had "considerable momentum" earlier this year, has been interrupted by recent outbreaks and tight public health restrictions over the last three months. Officials see contraction in the current quarter as a result but they also remain confident that the economy will bounce back quickly once public-health conditions improve, though they acknowledge that the timing of such an improvement is unclear. The bank also retained its assessment that underlying price pressures will build only gradually over the forecast period. Officials once again ruled out any rate increases until actual inflation holds sustainably in their 2 to 3 percent target range. They continue to expect "that this condition will not be met before 2024". Like the ECB and BoC, the Reserve Bank of Australia reaffirmed its commitment to keep policy highly accommodative to support economic recovery, keeping its main policy rate unchanged at a record low of 0.10 percent as expected. Citing Covid disruptions to the economy and uncertainty over the near-term outlook, the RBA said it will hold its bond purchases at A$4 billion per week at least until mid-February; the bank scaled back its purchases from $A5 billion per week at the beginning of the month. The bank noted that Australia's recovery, which had "considerable momentum" earlier this year, has been interrupted by recent outbreaks and tight public health restrictions over the last three months. Officials see contraction in the current quarter as a result but they also remain confident that the economy will bounce back quickly once public-health conditions improve, though they acknowledge that the timing of such an improvement is unclear. The bank also retained its assessment that underlying price pressures will build only gradually over the forecast period. Officials once again ruled out any rate increases until actual inflation holds sustainably in their 2 to 3 percent target range. They continue to expect "that this condition will not be met before 2024".
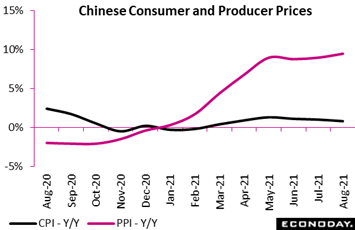 The week's economic data were mixed on net, China's inflation data offering an example. The country's consumer price index in August was up only 0.8 percent on the year, down 2 tenths from July and 2 tenths short of expectations. Headline inflation has slowed for three consecutive months and is at its lowest level since March. On the month, the index managed only a 0.1 percent gain, down from 0.3 percent in July (a yes vote for the transitory hypothesis). Food prices were down 4.1 percent on the year versus 3.7 percent in July, while non-food prices moderated from a 2.1 percent increase to 1.9 percent. In contrast, Chinese producer prices continued to advance, up 9.5 percent on the year in August which was up 5 tenths from July and 5 tenths above expectations. On the month, the PPI accelerated 2 tenths to 0.7 percent (a no vote for the transitory hypothesis). The week's economic data were mixed on net, China's inflation data offering an example. The country's consumer price index in August was up only 0.8 percent on the year, down 2 tenths from July and 2 tenths short of expectations. Headline inflation has slowed for three consecutive months and is at its lowest level since March. On the month, the index managed only a 0.1 percent gain, down from 0.3 percent in July (a yes vote for the transitory hypothesis). Food prices were down 4.1 percent on the year versus 3.7 percent in July, while non-food prices moderated from a 2.1 percent increase to 1.9 percent. In contrast, Chinese producer prices continued to advance, up 9.5 percent on the year in August which was up 5 tenths from July and 5 tenths above expectations. On the month, the PPI accelerated 2 tenths to 0.7 percent (a no vote for the transitory hypothesis).
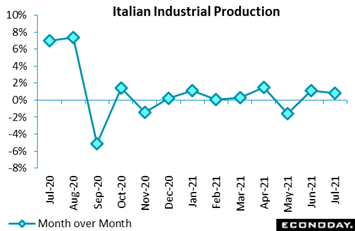 When it comes to good news, Italy has been out in front. Industrial production (ex-construction) rose a sharp 0.8 percent on the month, well above the market consensus and that after a 1.1 percent gain in June. July's increase means that production has still only contracted once (May) so far this year. Annual growth, due to negative base effects, did slow from 13.8 percent to 7.0 percent, but production now stands 1.5 percent above its level in February 2020. The July advance was again broad-based and led by capital goods which climbed 1.9 percent. Intermediates increased 1.4 percent and consumer goods 0.9 percent and the overall rise would have been larger but for a 1.5 percent fall in energy. The latest rise puts industrial production 0.9 percent above its average level in the second quarter when it rose 1.2 percent versus the first quarter. Though this hints at a smaller contribution from the sector to GDP growth this quarter, it also put Italy's economic consensus divergence index (ECDI) at a very solid 35. In contrast to most of the Eurozone, Italian economic activity in general is quite easily progressing faster than market expectations. When it comes to good news, Italy has been out in front. Industrial production (ex-construction) rose a sharp 0.8 percent on the month, well above the market consensus and that after a 1.1 percent gain in June. July's increase means that production has still only contracted once (May) so far this year. Annual growth, due to negative base effects, did slow from 13.8 percent to 7.0 percent, but production now stands 1.5 percent above its level in February 2020. The July advance was again broad-based and led by capital goods which climbed 1.9 percent. Intermediates increased 1.4 percent and consumer goods 0.9 percent and the overall rise would have been larger but for a 1.5 percent fall in energy. The latest rise puts industrial production 0.9 percent above its average level in the second quarter when it rose 1.2 percent versus the first quarter. Though this hints at a smaller contribution from the sector to GDP growth this quarter, it also put Italy's economic consensus divergence index (ECDI) at a very solid 35. In contrast to most of the Eurozone, Italian economic activity in general is quite easily progressing faster than market expectations.
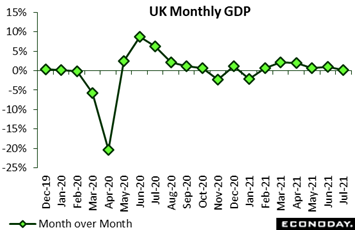 Good news is thinning out in the UK where GDP significantly undershot market expectations at the start of the quarter. July GDP rose just 0.1 percent on the month, well below June's 1.0 percent rate and its worst performance since it last contracted back in January. The minimal increase reduced 3-monthly growth from the second quarter's 4.8 percent to 3.6 percent while the yearly change more than halved to 7.5 percent. The economy was also 2.1 percent smaller than before the arrival of the pandemic in February last year. What little monthly growth there was came courtesy of the goods producing sector where output rebounded from a 0.7 percent drop in June to a 1.2 percent advance. However, within this, manufacturing was only unchanged following a modest 0.2 percent gain previously. Elsewhere, services were flat and construction down 1.6 percent, its fourth consecutive decline. Also released in the week was a deeper-than-expected trade deficit that showed dampened cross-border flows with the Eurozone. The disappointing results confirm a poor start for the third quarter and strongly support the view that the peak rate of growth in the current recovery cycle has now past. The data may also leave the Bank of England pondering whether its growth forecast for the rest of the year may need to be trimmed. Good news is thinning out in the UK where GDP significantly undershot market expectations at the start of the quarter. July GDP rose just 0.1 percent on the month, well below June's 1.0 percent rate and its worst performance since it last contracted back in January. The minimal increase reduced 3-monthly growth from the second quarter's 4.8 percent to 3.6 percent while the yearly change more than halved to 7.5 percent. The economy was also 2.1 percent smaller than before the arrival of the pandemic in February last year. What little monthly growth there was came courtesy of the goods producing sector where output rebounded from a 0.7 percent drop in June to a 1.2 percent advance. However, within this, manufacturing was only unchanged following a modest 0.2 percent gain previously. Elsewhere, services were flat and construction down 1.6 percent, its fourth consecutive decline. Also released in the week was a deeper-than-expected trade deficit that showed dampened cross-border flows with the Eurozone. The disappointing results confirm a poor start for the third quarter and strongly support the view that the peak rate of growth in the current recovery cycle has now past. The data may also leave the Bank of England pondering whether its growth forecast for the rest of the year may need to be trimmed.
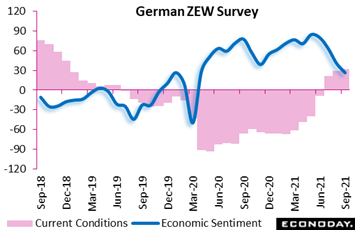 Many sentiment readings across regions have been going south, reflecting not only Covid uncertainty but also the global chip shortage and a general lack of key materials, including construction materials, which in Germany have hit profit expectations hard. Analyst assessments of current conditions are continuing to climb but in contrast to expectations which continue to sink. Current conditions in September's ZEW survey rose a further 2.6 points to 31.9, their seventh straight gain and their highest level since December 2018. This is well above their minus 7.7 long-term average. At the same time, however, economic sentiment (expectations) declined for the fifth time in the last six months. At 26.5, September's print was the lowest since March 2020 and some 57.9 points below its May peak. The latest levels of both measures are still consistent with positive economic growth through year-end but nothing to the extent foreseen just a few months ago. Many sentiment readings across regions have been going south, reflecting not only Covid uncertainty but also the global chip shortage and a general lack of key materials, including construction materials, which in Germany have hit profit expectations hard. Analyst assessments of current conditions are continuing to climb but in contrast to expectations which continue to sink. Current conditions in September's ZEW survey rose a further 2.6 points to 31.9, their seventh straight gain and their highest level since December 2018. This is well above their minus 7.7 long-term average. At the same time, however, economic sentiment (expectations) declined for the fifth time in the last six months. At 26.5, September's print was the lowest since March 2020 and some 57.9 points below its May peak. The latest levels of both measures are still consistent with positive economic growth through year-end but nothing to the extent foreseen just a few months ago.
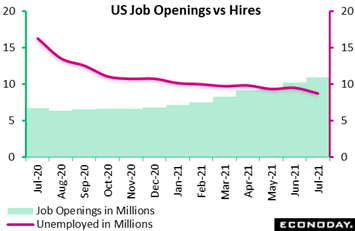 Just how disappointing the prior week's US employment report for August really was (headlined by a far lower-than-expected rise of 235,000 for nonfarm payrolls) will be the first point of debate at the Federal Reserve's policy meeting on September 21-22. One thing for sure, however, is that there were plenty of job openings to choose from, jumping more than 900,000 in data for July to 10.934 million and near the top of Econoday's consensus range. Relative to the 8.702 million of unemployed Americans who were actively looking for work in July, the gap between openings and employment widened by more than 1-1/2 million to 2.232 million. This separation underscores the common complaint among employers that willing, qualified workers are hard to find. Note that the winding down of emergency benefits, specifically expanded unemployment benefits that expired for millions during the week, will be an increasing wild card for US employment data in the weeks and months to come. In data for the prior week, initial US jobless claims fell a very sharp and surprising 35,000 to 310,000 for a new pandemic low. Going into the pandemic early last year, initial claims were running just over 200,000 per week. Just how disappointing the prior week's US employment report for August really was (headlined by a far lower-than-expected rise of 235,000 for nonfarm payrolls) will be the first point of debate at the Federal Reserve's policy meeting on September 21-22. One thing for sure, however, is that there were plenty of job openings to choose from, jumping more than 900,000 in data for July to 10.934 million and near the top of Econoday's consensus range. Relative to the 8.702 million of unemployed Americans who were actively looking for work in July, the gap between openings and employment widened by more than 1-1/2 million to 2.232 million. This separation underscores the common complaint among employers that willing, qualified workers are hard to find. Note that the winding down of emergency benefits, specifically expanded unemployment benefits that expired for millions during the week, will be an increasing wild card for US employment data in the weeks and months to come. In data for the prior week, initial US jobless claims fell a very sharp and surprising 35,000 to 310,000 for a new pandemic low. Going into the pandemic early last year, initial claims were running just over 200,000 per week.
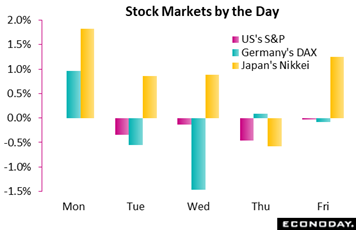 Hawkish Fedspeak, unexpected following the soft US employment report, scattered US shares in the week. St. Louis Federal Reserve President James Bullard repeated his call for tapering, while New York Fed President John Williams, who is regarded as a dove, told reporters that tapering this year, if job growth picks up, "could be appropriate". The Fed's Michelle Bowman, who sits on the board in Washington, said she's upbeat about the recovery and warned that we shouldn't "take too much signal" from the big payroll miss. Going into the week's ECB meeting, Austrian central banker Robert Holzmann said policy may need to be normalized sooner than expected, though Slovenia's Bostjan Vasle said policy needs to stay loose to counter the new waves of Covid. Separately, Bank of England officials spoke of the need for tighter UK policy. But less stimulus isn't the topic in Japan, not with new political leadership on the way. Hopes that Covid is peaking and talk that Japanese shares are undervalued were further positives, helping the Nikkei post a 4.3 percent gain in the week. Hawkish Fedspeak, unexpected following the soft US employment report, scattered US shares in the week. St. Louis Federal Reserve President James Bullard repeated his call for tapering, while New York Fed President John Williams, who is regarded as a dove, told reporters that tapering this year, if job growth picks up, "could be appropriate". The Fed's Michelle Bowman, who sits on the board in Washington, said she's upbeat about the recovery and warned that we shouldn't "take too much signal" from the big payroll miss. Going into the week's ECB meeting, Austrian central banker Robert Holzmann said policy may need to be normalized sooner than expected, though Slovenia's Bostjan Vasle said policy needs to stay loose to counter the new waves of Covid. Separately, Bank of England officials spoke of the need for tighter UK policy. But less stimulus isn't the topic in Japan, not with new political leadership on the way. Hopes that Covid is peaking and talk that Japanese shares are undervalued were further positives, helping the Nikkei post a 4.3 percent gain in the week.
Next to Italy's 35, Canada at 26 and the US at 22 are doing the best on Econoday's consensus divergence scores, both getting lifts from the week's employment data. Germany didn't get any lift from the ZEW report but did get a boost from manufacturing orders and industrial production which both beat expectations to pull the country out of the negative column, though just barely at plus 4. A level near zero indicates that data are generally meeting expectations which includes the Eurozone and UK, both only just below the zero line at minus 4 each. But chilling the rundown is China where the only positive thing to say about its minus 57 score is that it's up from minus 71 in the prior week.
**Contributing to this article were Jeremy Hawkins, Brian Jackson, Mace News, Max Sato, and Theresa Sheehan
Extended slowing is the expectation for Chinese data in what will be major headlines all on Wednesday: fixed asset investment, industrial production, and retail sales. Japanese data will open the week on Monday with producer prices followed on Wednesday by machinery orders and merchandise trade on Thursday: mixed results are the expectations here. Canada will post manufacturing sales, consumer prices, and housing starts with mixed results also the expectation. Only a little cooling is seen for average earnings in the UK labour market report on Tuesday with a rebound the call for country's retail sales on Friday. The UK will post consumer and producer prices on Wednesday. US data will be headlined by consumer prices on Tuesday amid expectations for steady pressure; solid gains for industrial production is expected on Wednesday. Not expected to be solid at all are US retail sales where another sharp decline is Econoday's consensus, nor consumer sentiment where only a marginal gain from very deep lows is the expectation. A bonus in the week will be Monday's consumer price report from India -- unrelenting heat is the call.
Japanese Producer Price Index for August (Sun 23:50 GMT; Mon 08:50 JST; Sun 19:50 EDT)
Consensus Forecast, Month over Month: 0.2%
Consensus Forecast, Year over Year: 5.6%
Producer prices are expected to rise a monthly 0.2 percent in August for an annual rate and 13-year high of 5.6 percent. This would compare with plus 0.6 percent and would match July's 5.6 percent annual rate.
Indian CPI for August (Mon 12:00 GMT; Mon 17:30 IST; Mon 08:00 EDT)
Consensus Forecast, Year over Year: 5.7%
After peaking over 6-1/4 percent in May and June, consumer inflation slowed to 5.59 percent in July. August's consensus is 5.7 percent.
UK Labour Market Report (Tue 06:00 GMT; Tue 07:00 BST; Tue 02:00 EDT)
Consensus Forecast, ILO Unemployment Rate for July: 4.7%
Consensus Forecast, Average Earnings for July: 8.1%
The ILO unemployment rate is expected to hold at 4.7 percent in data for the three months to July. Average hourly earnings for the same period are expected to slip to 8.1 percent from 8.8 percent.
US CPI for August (Tue 12:30 GMT; Tue 08:30 EDT)
Consensus Forecast, Month over Month: 0.4%
Consensus Forecast, Year over Year: 5.3%
US CPI Core, Less Food & Energy
Consensus Forecast, Month over Month: 0.3%
Consensus Forecast, Year over Year: 4.2%
Forecasters are looking for a 0.4 percent overall increase in August and a 0.3 percent rise for the core which would compare with 0.5 and 0.3 percent in July. Respective annual rates are seen at 5.3 percent and 4.2 percent which would compare with 5.4 percent and 4.3 percent.
Canadian Manufacturing Sales for July (Tue 12:30 GMT; Tue 08:30 EDT)
Consensus Forecast, Month over Month: -0.9%
After rebounding 2.1 percent in June, which followed two prior declines, manufacturing sales are expected to fall 0.9 percent in July.
Japanese Machinery Orders for July (Tue 23:50 GMT; Wed 08:50 JST; Tue 19:50 EDT)
Consensus Forecast, Month over Month: 3.0%
Consensus Forecast, Year over Year: 15.7%
After falling 1.5 percent in June, machinery orders are expected to rebound 3.0 percent on the month in July. The annual rate is seen at 15.7 percent versus 18.6 percent previously.
Chinese Fixed Asset Investment for August (Wed 02:00 GMT; Wed 10:00 CST; Tue 22:00 EDT)
Consensus Forecast, Year-to-Date on Y/Y Basis: 9.1%
Growth in Chinese fixed asset investment is expected to slow in August to 9.1 percent on a year-to-date year-over-year basis versus 10.3 percent in July. This reading has slowed steadily all year.
Chinese Industrial Production for August (Wed 02:00 GMT; Wed 10:00 CST; Tue 22:00 EDT)
Consensus Forecast, Year over Year: 5.8%
Industrial production in August is expected to continue slow on an annual basis, to 5.8 percent from 6.4 percent in July which compared with expectations at the time for 7.9 percent.
Chinese Retail Sales for August (Wed 02:00 GMT; Wed 10:00 CST; Tue 22:00 EDT)
Consensus Forecast, Year over Year: 7.1%
Retail sales growth in July came in 3 percentage points below expectations, at an annual 8.5 percent with further slowing to 7.1 percent the consensus for August.
UK CPI for August (Wed 06:00 GMT; Wed 07:00 BST; Wed 02:00 EDT)
Consensus Forecast, Month over Month: 0.5%
Consensus Forecast, Year over Year: 2.9%
Consumer prices were much weaker than expected in July, unchanged on the month and down 5 tenths on the year to 2.0 percent. The consensus for August is a monthly increase of 0.5 percent for an annual rate of 2.9 percent.
UK PPI for August (Wed 06:00 GMT; Wed 07:00 BST; Wed 02:00 EDT)
Consensus Forecast, Input Prices - M/M: 0.4%
Input costs are seen rising 0.4 percent on the month in August versus July's 0.6 percent increase.
Canadian CPI for August (Wed 12:30 GMT; Wed 08:30 EDT)
Consensus Forecast, Month over Month: 0.1%
Consensus Forecast, Year over Year: 3.9%
Forecasters are calling for a 0.1 percent increase on the month in August, versus 0.6 percent in July, and 3.9 percent on the year which would compare with July's 3.7 percent.
US Industrial Production for August (Wed 13:15 GMT; Wed 09:15 EDT)
Consensus Forecast, Month over Month: 0.5%
US Manufacturing Output
Consensus Forecast, Month over Month: 0.4%
A swing higher for vehicle production drove industrial production up a much higher-than-expected 0.9 percent in July. Econoday's consensus for August is a 0.5 percent increase with the manufacturing component expected to rise 0.4 percent.
Japanese Merchandise Trade for August (Wed 23:50 GMT; Thu 08:50 JST; Wed 19:50 EDT)
Consensus Forecast: -¥ 49.0 billion
Consensus Forecast, Imports Y/Y: 40.0%
Consensus Forecast, Exports Y/Y: 34.0%
Forecasters see Japan's merchandise trade balance coming in at a ¥49.0 billion deficit in August following a higher-than-expected surplus of ¥441.0 billion in July. Exports were up a year-over-year 37.0 percent in July.
Australian Labour Force Survey for August (Thu 01:30 GMT; Thu 11:30 AEST; Wed 21:30 EDT)
Consensus Forecast, Employment: -68,000
Public health restrictions weakened Australia's recovery in July with similar effects expected for August. Employment, which rose a much lower-than-expected 2,200 in July, is expected to fall 68,000 in August.
Canadian Housing Starts for August (Thu 12:15 GMT; Thu 08:15 EDT)
Consensus Forecast, Annual Rate: 275,000
After 272,176 in July, housing starts in August are expected to rise to a 275,000 annual rate.
US Retail Sales for August (Thu 12:30 GMT; Thu 08:30 EDT)
Consensus Forecast, Month over Month: -0.8%
Consensus Forecast, Ex-vehicles - M/M: -0.1%
Consensus Forecast, Ex-vehicles Ex-Gas - M/M: -0.3%
After a weak July that showed broad declines, Econoday's consensus for August is a 0.8 percent fall in overall retail sales with ex-vehicles seen down 0.1 percent and ex-vehicles ex-gas down 0.3 percent.
UK Retail Sales for August (Fri 06:00 GMT; Fri 07:00 BST; Fri 02:00 EDT)
Consensus Forecast, Month over Month: 0.7%
Retail sales fell unexpectedly and sharply in July, down 2.5 percent on the month with a rebound of 0.7 percent the expectation for August.
US Consumer Sentiment Index, Preliminary September (Fri 14:00 GMT; Fri 10:00 EDT)
Consensus Forecast: 72.0
Consumer sentiment literally plunged in August, down more than 10 points to 70.3 for one of the very worst showings on record. Forecasters understandably see a rebound in September but only a limited one, with Econoday's consensus at 72.0.
|
