|
Even though most economists have been claiming that the latest recession ended in mid-2009, we only just got official confirmation. Of course, the ensuing recovery has been modest with growth (or continuing decline) varying by sector. While manufacturing clearly has been a driver behind economic growth, has housing come out of recession' We had an update on this sector every trading day of the week.
 The September rally picked up steam this week. The big moves were at open and close of the week. Positive corporate news overwhelmed a dismal Housing Market Index report. Lennar Corp, the U.S.’s third largest homebuilder, topped earnings estimates and IBM announced a takeover bid for Netezza Corp. Also, Discover boosted financials with third quarter profits that exceeded estimates. The National Bureau of Economic Research’s declaration that the U.S. recession ended in June 2009 added to the positive mood. On an incidental note, BP announced the day before that its Macondo well in the Gulf of Mexico had been cemented shut, effectively killing the well. The September rally picked up steam this week. The big moves were at open and close of the week. Positive corporate news overwhelmed a dismal Housing Market Index report. Lennar Corp, the U.S.’s third largest homebuilder, topped earnings estimates and IBM announced a takeover bid for Netezza Corp. Also, Discover boosted financials with third quarter profits that exceeded estimates. The National Bureau of Economic Research’s declaration that the U.S. recession ended in June 2009 added to the positive mood. On an incidental note, BP announced the day before that its Macondo well in the Gulf of Mexico had been cemented shut, effectively killing the well.
Equities were mostly down on Tuesday despite an announcement by the Fed that it is willing to engage in additional quantitative easing if needed. Traders focused more on the Fed downgrading its forecast for the economy. The Fed statement more than offset an unexpected jump in housing starts. This concern from the Fed announcement continued to bump stocks down at mid-week. A report showing a dip in housing prices also weighed on equities.
Thursday saw mixed economic news but a rise in initial jobless claims more than offset improvement in existing home sales and in the index of leading indicators. As had been expected, video-rental chain Blockbuster filed for Chapter 11 bankruptcy protection but will continue to operate many stores.
At the end of the week, stocks indexes surged—generally 2 to 3-1/2 percent for the day. Setting the stage, after close on Thursday, Nike reported a surge in quarterly revenue, suggesting some strength in the consumer sector. Also, before U.S. markets opened, factory orders jumped in China. But the big lift for the U.S. came from a better-than-expected gain in U.S. ex-transportation durables orders outweighing a flat report on new home sales. By the last day of trading, worries about a double dip—or rather second recession—had faded.
Equities were up sharply this past week. The Dow was up 2.4 percent; the S&P 500, up 2.1 percent; the Nasdaq, up 2.8 percent; and the Russell 2000, up 3.0 percent.
For the year-to-date, major indexes are up as follows: the Dow, up 4.1 percent; the S&P 500, up 3.0 percent; the Nasdaq, up 4.9 percent; and the Russell 2000, up 7.3 percent.
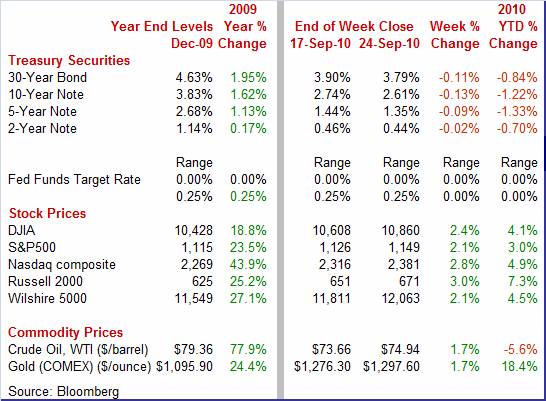
Weekly percent change column reflects percent changes for all components except interest rates. Interest rate changes are reflected in simple differences.
 Treasury yields declined this week primarily thanks to the Fed. Weakness was particularly notable for mid- and longer-term maturities. Rates started to slip on Monday in anticipation that the Fed on Tuesday would announce further quantitative easing measures in its FOMC announcement. Indeed, on Tuesday rates dropped sharply after the FOMC announcement included language that the Fed is preparing for additional easing. Rates recovered partially on Friday on a healthy durables orders report and as funds flowed into equities as stocks rallied sharply for the day. Treasury yields declined this week primarily thanks to the Fed. Weakness was particularly notable for mid- and longer-term maturities. Rates started to slip on Monday in anticipation that the Fed on Tuesday would announce further quantitative easing measures in its FOMC announcement. Indeed, on Tuesday rates dropped sharply after the FOMC announcement included language that the Fed is preparing for additional easing. Rates recovered partially on Friday on a healthy durables orders report and as funds flowed into equities as stocks rallied sharply for the day.
 For this past week Treasury rates were down as follows: 3-month T-bill, down 1 basis point; the 2-year note, down 2 basis points; the 5-year note, down 9 basis points; the 7-year note, down 15 basis points; the 10-year bond, down 13 basis points; and the 30-year bond, down 11 basis points. For this past week Treasury rates were down as follows: 3-month T-bill, down 1 basis point; the 2-year note, down 2 basis points; the 5-year note, down 9 basis points; the 7-year note, down 15 basis points; the 10-year bond, down 13 basis points; and the 30-year bond, down 11 basis points.
The yield curve continues to be under downward pressure at mid- and long-term maturities due to expectations that the Fed will be making purchases of these Treasuries to maintain or even expand its balance sheet.
 Crude oil prices netted a modest gain for the week. There were no dramatic moves in oi prices during the week as prices were choppy day to day. Crude got some lift Monday from sizeable gains in equities, indicating economic growth will pick up. But worries about low operating rates at refineries pushed rates down on Tuesday with a jump in inventories bumping prices down at mid-week. The Fed’s downgrade to the economy also weighed on prices. Crude oil prices netted a modest gain for the week. There were no dramatic moves in oi prices during the week as prices were choppy day to day. Crude got some lift Monday from sizeable gains in equities, indicating economic growth will pick up. But worries about low operating rates at refineries pushed rates down on Tuesday with a jump in inventories bumping prices down at mid-week. The Fed’s downgrade to the economy also weighed on prices.
 But the spot price of West Texas Intermediate recovered the last two days of trading as the index of leading indicators beat expectations on Thursday and existing home sales topped expectations. A drop in the dollar bumped crude up further on Friday with the sharp rally in equities and commodities in general also contributing. But the spot price of West Texas Intermediate recovered the last two days of trading as the index of leading indicators beat expectations on Thursday and existing home sales topped expectations. A drop in the dollar bumped crude up further on Friday with the sharp rally in equities and commodities in general also contributing.
Net for the week, spot prices for West Texas Intermediate rose $1.28 per barrel to settle at $74.94.
This past week a deluge of housing data indicates that this sector is still quite soft but also suggests it may have stabilized and even may be starting to improve.
 The best news on housing showed up in the housing starts report. Housing starts was unexpectedly strong in August as starts jumped 10.5 percent after rising a modest 0.4 percent in July. The August annualized pace of 0.598 million units sharply topped analysts’ expectations for 0.550 million units and is actually up 2.2 percent on a year-ago basis. The best news on housing showed up in the housing starts report. Housing starts was unexpectedly strong in August as starts jumped 10.5 percent after rising a modest 0.4 percent in July. The August annualized pace of 0.598 million units sharply topped analysts’ expectations for 0.550 million units and is actually up 2.2 percent on a year-ago basis.
Here’s where we need to parse the numbers to judge underlying strength. The gain in August was led by a 32.2 percent surge in multifamily starts, following a 36.0 percent increase in July. The single-family component rebounded a far more moderate 4.3 percent after dipping 6.7 percent in July. This appears to be a pattern elsewhere—the single-family component is not showing as much life as the multifamily component.
Permits improved in the latest month, rising 1.8 percent after declining 4.1 percent in July. Overall permits came in at an annualized rate of 0.569 million units and are down 6.7 percent on a year-ago basis. Again, August strength was in the multifamily component which rebounded 9.8 percent while single-family permits fell another 1.2 percent.
We are not likely to see much improvement in the single-family component in September as homebuilders are still pessimistic about prospects. The National Association of Homebuilders Housing Market Index remained stuck in September at an abysmal reading with the traffic component (reflecting those passing through model homes) actually slipping.
The bottom line is that the starts report was probably better news for construction workers than for real estate brokers. The single-family component is up but still at a low pace but hard hats will be glad to get work in the improving apartment market.
 But there are signs that housing has started a modest comeback after hitting bottom. Existing home sales rose 7.6 percent in August to a 4.130 million annual rate, up substantially from July's 3.840 million rate. Gains were broad based across regions. And supply edged down to 11.6 months from a recent high of 12.5 in July. Still inventories are quite bloated and are weighing on prices. But there are signs that housing has started a modest comeback after hitting bottom. Existing home sales rose 7.6 percent in August to a 4.130 million annual rate, up substantially from July's 3.840 million rate. Gains were broad based across regions. And supply edged down to 11.6 months from a recent high of 12.5 in July. Still inventories are quite bloated and are weighing on prices.
Without the help of special tax incentives boosting demand, prices dipped 1.9 percent to a median $178,600.
The headline number for existing home sales includes single-family and multifamily components. Single-family home sales rose 7.4 percent to an annual rate of 3.62 million in August. But relative strength was in existing condominium and co-op sales which increased 8.5 percent to an annual rate of 510,000 in August. Again, households on the housing market appear to be making a choice toward smaller as apartments and condos are gaining favor—at least for now.
 We are seeing very little bounce in new home sales following the drop in May after the April deadline for special tax credits. New home sales were unchanged in August at a 288,000 annual unit rate but were up from the initial estimate for July of 276,000. With the exception of June sales coming in at 312,000, recent months have been only barely above the series low of 282,000 set in May of this year. We are seeing very little bounce in new home sales following the drop in May after the April deadline for special tax credits. New home sales were unchanged in August at a 288,000 annual unit rate but were up from the initial estimate for July of 276,000. With the exception of June sales coming in at 312,000, recent months have been only barely above the series low of 282,000 set in May of this year.
But homebuilders remain cautious about adding to inventories. Supply is being swollen by a lack of sales not by the proportion of homes on the market as total supply fell 1.4 percent to 206,000 for the lowest level since way back in 1968. Heavy supply continues to wear down prices which ticked mostly lower in August including a 0.6 percent slip for the median price to $204,700 and a new seven-year low.
 While sales have come off recent lows and may be seeing stability or modest upward movement, house prices are not. House prices are back on a downtrend after tax credit induced gains earlier in the year. The Federal Housing Finance Agency’s (FHFA) purchase only house price index slipped 0.5 percent in July after declining a revised 1.2 percent the month before. June originally was estimated to be a 0.3 percent dip. The FHFA said the downward revision was due to much weaker prices late in the month that had not yet been reported. Prices had risen over the February through April period as purchases heated up prior to the end of April deadline for qualifying for special tax credits. While sales have come off recent lows and may be seeing stability or modest upward movement, house prices are not. House prices are back on a downtrend after tax credit induced gains earlier in the year. The Federal Housing Finance Agency’s (FHFA) purchase only house price index slipped 0.5 percent in July after declining a revised 1.2 percent the month before. June originally was estimated to be a 0.3 percent dip. The FHFA said the downward revision was due to much weaker prices late in the month that had not yet been reported. Prices had risen over the February through April period as purchases heated up prior to the end of April deadline for qualifying for special tax credits.
On a year-on-year basis, this index was down 3.3 percent, compared to down 2.6 percent in July. This index is based on resale prices for homes financed or bundled by federal housing agencies. The Case-Shiller Home Price Index through June has not yet turned back negative on a month-ago basis, but that index is based on a three-month-moving average of underlying price data.
 New factory orders for durable goods in August dipped 1.3 percent, following a 0.7 percent rebound in July. But the underlying trend is back to positive. Excluding transportation, new durables orders gained 2.0 percent, following a 2.8 percent drop in July. This series has risen in three of the last four months and in five of the last seven. New factory orders for durable goods in August dipped 1.3 percent, following a 0.7 percent rebound in July. But the underlying trend is back to positive. Excluding transportation, new durables orders gained 2.0 percent, following a 2.8 percent drop in July. This series has risen in three of the last four months and in five of the last seven.
Headline weakness was narrowly focused in the transportation component which dropped 10.3 percent, following an 11.6 percent boost in July. The recent swings primarily reflect monthly volatility in Boeing orders. Nondefense aircraft plunged a monthly 40.2 percent after surging 69.1 percent the month before. Defense aircraft orders slipped 2.7 percent in August while motor vehicles declined 4.4 percent.
Again, outside of transportation, gains were broad based and healthy. Primary metals were up 2.4 percent; fabricated metals, up 1.0 percent; machinery, up 3.9 percent; computers & electronics, up 3.8 percent; electrical equipment, up 0.5 percent; and “other,” up 0.1 percent.
Business investment in equipment is on a volatile uptrend. Nondefense capital goods orders excluding aircraft in August rebounded 4.1 percent, following a 5.3 percent fall in July. Shipments for this series advanced 1.6 percent in August after edging up 0.1 percent the month before. So far, the shipments data indicate a moderate gain in the business equipment component of GDP for the third quarter.
According to a news release this past Monday, the Business Cycle Dating Committee of the National Bureau of Economic Research declared that the latest recession troughed (hit bottom) in June 2009. This marks the end of the recession that began in December 2007. June 2009 is also the beginning of an expansion. The recession lasted 18 months, which makes it the longest of any recession since World War II. Previously, the longest postwar recessions were those of 1973-75 and 1981-82, both of which lasted 16 months.
Does this rule out a “double dip” recession' If you mean an extension of the latest recession if the economy falters, yes, that is ruled out.
"The committee decided that any future downturn of the economy would be a new recession and not a continuation of the recession that began in December 2007. The basis for this decision was the length and strength of the recovery to date."
So, the recession began in December 2007 and ended June 2009. The NBER basically defines the date as sometime within the month since the current economic expansion also is defined to have begun June 2009.
The business cycle dating committee appears to have expanded the monthly indicators getting key attention. And it deemphasized some others. Industrial production and business sales have been given reduced importance.
 "Identifying the date of the trough involved weighing the behavior of various indicators of economic activity. The estimates of real GDP and GDI issued by the Bureau of Economic Analysis of the U.S. Department of Commerce are only available quarterly. Further, macroeconomic indicators are subject to substantial revisions and measurement error. For these reasons, the committee refers to a variety of monthly indicators to choose the months of peaks and troughs. It places particular emphasis on measures that refer to the total economy rather than to particular sectors. These include a measure of monthly GDP that has been developed by the private forecasting firm Macroeconomic Advisers, measures of monthly GDP and GDI that have been developed by two members of the committee in independent research (James Stock and Mark Watson), real personal income excluding transfers, the payroll and household measures of total employment, and aggregate hours of work in the total economy. The committee places less emphasis on monthly data series for industrial production and manufacturing-trade sales, because these refer to particular sectors of the economy. Movements in these series can provide useful additional information when the broader measures are ambiguous about the date of the monthly peak or trough. There is no fixed rule about what weights the committee assigns to the various indicators, or about what other measures contribute information to the process." "Identifying the date of the trough involved weighing the behavior of various indicators of economic activity. The estimates of real GDP and GDI issued by the Bureau of Economic Analysis of the U.S. Department of Commerce are only available quarterly. Further, macroeconomic indicators are subject to substantial revisions and measurement error. For these reasons, the committee refers to a variety of monthly indicators to choose the months of peaks and troughs. It places particular emphasis on measures that refer to the total economy rather than to particular sectors. These include a measure of monthly GDP that has been developed by the private forecasting firm Macroeconomic Advisers, measures of monthly GDP and GDI that have been developed by two members of the committee in independent research (James Stock and Mark Watson), real personal income excluding transfers, the payroll and household measures of total employment, and aggregate hours of work in the total economy. The committee places less emphasis on monthly data series for industrial production and manufacturing-trade sales, because these refer to particular sectors of the economy. Movements in these series can provide useful additional information when the broader measures are ambiguous about the date of the monthly peak or trough. There is no fixed rule about what weights the committee assigns to the various indicators, or about what other measures contribute information to the process."
A chart comparing monthly GDP (Macroeconomic Advisers’ version) with nonfarm payroll employment, it is clear that the measure of production played a bigger role than employment in determining the turning points. Also, the latest recession clearly had a sharper drop in output than the 2001 recession and also a far more drastic reduction in jobs.
 Based on the latest reading of the index of leading indicators, the recovery will continue in the near term and not turn into another recession. This index advanced 0.3 percent in August, following a 0.1 percent rise the month before. As has been typical for many months, the biggest contributor to the latest gain was the interest rate spread (10-year T-bond less fed funds), adding 0.27 percentage points. Money supply’s contribution was 0.11 percentage points while the factory workweek added 0.07 percentage points. Also providing lift were housing permits, stock prices, consumer expectations, and factory orders for nondefense capital goods. Based on the latest reading of the index of leading indicators, the recovery will continue in the near term and not turn into another recession. This index advanced 0.3 percent in August, following a 0.1 percent rise the month before. As has been typical for many months, the biggest contributor to the latest gain was the interest rate spread (10-year T-bond less fed funds), adding 0.27 percentage points. Money supply’s contribution was 0.11 percentage points while the factory workweek added 0.07 percentage points. Also providing lift were housing permits, stock prices, consumer expectations, and factory orders for nondefense capital goods.
The biggest negative was initial jobless claims with a minus 0.19 percentage point contribution. Also weighing down on the composite were supplier deliveries and factory orders for consumer goods & materials.
The report's coincident index has been very sluggish lately, coming in flat in August after edging up only 0.1 percent the month before. These numbers are consistent with the view that third quarter GDP growth is going to be soft.
Looking ahead, known (or known for most of the month) components for the leading index are mixed. We should get a big boost from stocks and positives also from the interest rate spread. However, with the Fed making purchases of Treasuries, the 10-year note yield has been coming down and will reduce this component’s contribution. Also, consumer expectations have slipped back.
 As expected, the Fed left policy rates unchanged but appears to have begun preparations for additional easing—possibly at the post-election November FOMC. The fed funds target range was left unchanged at a range of zero to 0.25 percent and, again, the Fed stated that this rate is expected to remain low for an "extended period." Kansas City Fed President Hoenig continued to dissent, voting against the extended period language. As expected, the Fed left policy rates unchanged but appears to have begun preparations for additional easing—possibly at the post-election November FOMC. The fed funds target range was left unchanged at a range of zero to 0.25 percent and, again, the Fed stated that this rate is expected to remain low for an "extended period." Kansas City Fed President Hoenig continued to dissent, voting against the extended period language.
The Fed still characterized the economy with "the pace of recovery in output and employment has slowed in recent months." But there appears to a subtle downgrade in the outlook in other language. In August, the Fed said that the pace of economic recovery is likely to be "more modest in the near term than had been anticipated. Now, the Fed states that "the pace of economic recovery is likely to be modest in the near term." Yes, this is subtle and it can only be assumed that "modest" is a downgrade from "more modest" "than had been anticipated" since nearly all economists have lowered their forecasts for the near term.
Importantly, the Fed made some key changes in the announcement which appear to portend additional easing. The statement first focuses on changes in inflation.
"Measures of underlying inflation are currently at levels somewhat below those the Committee judges most consistent, over the longer run, with its mandate to promote maximum employment and price stability." The "somewhat below" language is in contrast to measures of inflation have "trended lower" in the previous statement. Basically, the Fed is saying inflation is too low—at least at the core level—and is willing to take action to boost it back to its implicit target range of 1-1/2 to 2 percent.
 Regarding the balance sheet, the FOMC said that the "Committee also will maintain its existing policy of reinvesting principal payments from its securities holdings." But a key change in wording immediately followed. Regarding the balance sheet, the FOMC said that the "Committee also will maintain its existing policy of reinvesting principal payments from its securities holdings." But a key change in wording immediately followed.
"The Committee will continue to monitor the economic outlook and financial developments and is prepared to provide additional accommodation if needed to support the economic recovery and to return inflation, over time, to levels consistent with its mandate."
Basically, the Fed is saying that it may be planning additional quantitative easing. This could mean additional purchases of longer-term Treasuries or even re-establishing special lending facilities to focus on certain sectors such as small business lending or mortgage markets. However, some within the FOMC have indicated they prefer for the Fed to reduce its holdings of securities outside of Treasuries.
Regardless, the Fed appears to be hunkering down for an extended period of low interest rates and a heavily expanded balance sheet. According to the fed funds futures market, traders do not expect the Fed to start tightening interest rates until latter 2011.
Housing appears to have bottomed but recovery is marginal with strength mainly in the multifamily component. Recovery in this sector is going to be very slow until hiring strengthens and workers start job hopping. Fortunately, manufacturing is retaining much of its strength. But that sector is relying less so on the consumer and more on exports.
Thursday, we close out second quarter GDP with the Commerce Department’s third estimate. But on Friday, the consumer takes center stage with the personal income report, motor vehicle sales, and consumer sentiment. Traders also get a manufacturing update that morning with September’s ISM for manufacturing.
The Conference Board's consumer confidence index rebounded to 53.5 in August from 51.0 in July. But it was still down almost 10 points from May. The jobs picture is what concerns consumers the most. Consumers were slightly less pessimistic about future employment prospects. Those expecting more jobs in the months ahead increased to 14.6 percent from 14.2 percent. The proportion of consumers expecting an increase in their incomes held steady at 10.6 percent.
Consumer confidence Consensus Forecast for September 10: 52.0
Range: 51.0 to 54.0
GDP growth for the second quarter in the August release was downgraded by the Commerce Department to 1.6 percent annualized from the advance estimate of 2.4 percent. The downward revision was primarily due to a higher net export deficit and a smaller gain in inventories. Also getting downgrades were residential investment and government purchases. Partially offsetting were modest upward revisions to personal consumption and nonresidential fixed investment. Real final sales to domestic purchasers were revised up to 4.3 percent from the initial estimate of 4.1 percent while final sales of domestic product (net exports are included) were revised down to 1.0 percent from the advance figure of 1.3 percent. The GDP price index came at a relatively strong 1.9 percent—primarily due to the technical interaction of imports and exports. The price index for gross domestic purchasers was up only 0.1 percent.
Real GDP Consensus Forecast for third estimate Q2 10: +1.6 percent annual rate
Range: +1.3 to +1.7 percent annual rate
GDP price index Consensus Forecast for third estimate Q2 10: +1.9 percent annual rate
Range: +1.8 to +2.0 percent annual rate
Initial jobless claims in the September 18 week, which did not include Labor Day, rose 12,000 to a higher-than-expected 465,000. The prior week, which included Labor Day, was revised 3,000 higher to 453,000. Adjustments factored in a low level of filings for the shortened week and a high level in the following week as government offices catch up on the work. The four-week average of 463,250 was down for the week and was down more than 10,000 from a month ago.
Jobless Claims Consensus Forecast for 9/25/10: 459,000
Range: 452,000 to 465,000
The Chicago PMI for August came in at 56.7, down sizably from 62.3 in July but still well above breakeven 50. September, however, may soften as August new orders posted at 55.0, down from July's 64.6 for the slowest reading of the year.
Chicago PMI Consensus Forecast for September 10: 56.0
Range: 54.7 to 58.0
Sales of domestic light motor vehicles slipped 3.8 percent August to an annualized 8.3 million from 8.7 million in July. Imports gained 8.8 percent to 3.1 million from 2.9 million in July. Net, consumers and fleet purchasing managers are still heading to the showrooms as total sales of domestics and imports of autos and light trucks for August came in at an annualized 11.5 million units, matching the July pace. If you want to be picky, it was 11.47 million in August, down 0.6 percent from 11.54 million in August. On the margin, sales are holding up. But without a doubt, the latest was sharply lower than the cash-for-clunkers jacked number of 14.2 million in August 2009.
Motor vehicle domestic sales Consensus Forecast for September 10: 8.6 million-unit rate
Range: 8.5 to 8.8 million-unit rate
Personal income in July posted a 0.2 percent gain, following no change in June. More importantly, the wages & salaries component rebounded 0.3 percent after slipping 0.1 percent in June. This component would have been even stronger had it not been for a dip in government payrolls from the laying off temporary Census workers. Private industry wages and salaries gained 0.5 percent in July, following a 0.1 percent dip in June. Overall personal consumption increased 0.4 percent in July, following a flat number in June. Headline PCE inflation came in at plus 0.2 percent in July, following two months of down 0.1 percent. The core rate edged up 0.1 percent after a flat reading in June. Looking ahead, the wages & salaries component for personal income should be quite healthy in August as aggregate earnings jumped 0.6 percent in the employment report. Personal spending should be moderately strong as retail sales excluding autos jumped 0.6 percent. However, unit motor vehicle sales were flat in August. PCE inflation likely will be mixed as the headline CPI jumped 0.3 percent while the core CPI was unchanged for August.
Personal income Consensus Forecast for August 10: +0.3 percent
Range: +0.2 to +0.4 percent
Personal consumption expenditures Consensus Forecast for August 10: +0.4 percent
Range: +0.3 to +0.5 percent
Core PCE price index Consensus Forecast for August 10: +0.1 percent
Range: 0.0 to +0.1 percent
The Reuter's/University of Michigan's Consumer sentiment index for the mid-September reading fell 2.1 points to 66.6 to erase the gain made in August. The reading was the lowest since the 66.5 figure for July, a month when sentiment suddenly nose dived. Although the current conditions index for mid-September came in at 78.4 versus 78.3 for final August, the expectations index dropped to 59.1 from 62.9 in August. The latter is at its lowest reading of the recovery but at least somewhat above the recession low of 49.2. With initial jobless claims trending down and stocks up sharply, there could be modest improvement for the final reading for September.
Consumer sentiment Consensus Forecast for final September 10: 67.0
Range: 66.0 to 68.5
The composite index from the ISM manufacturing survey came in at a stronger-than-expected 56.3 for a sizable eight tenths gain from July. The reading was well over 50 to signal month-to-month growth and also accelerating growth in the comparison with July. But September may ease a bit as August’s new orders index dipped four tenths to 53.1 for its lowest reading since the manufacturing recovery began early last year.
ISM manufacturing composite index Consensus Forecast for September 10: 54.5
Range: 53.0 to 55.5
Construction spending in July fell 1.0 percent, following a 0.8 percent drop in June. The dip in July was led by a 2.6 percent drop in private residential outlays, following a 2.0 percent decline the prior month. Public construction also fell-by 1.2 percent after a 0.6 percent gain in June. In contrast, the private nonresidential component rose 0.8 percent, following a string of declines. Looking ahead, August may show some improvement in the private residential component, based on the unexpected 10.5 percent surge in housing starts for the month.
Construction spending Consensus Forecast for August 10: -0.4 percent
Range: -0.7 to +0.3 percent
R. Mark Rogers is the author of The Complete Idiot’s Guide to Economic Indicators, Penguin Books, October 2009.
Econoday Senior Writer Mark Pender contributed to this article.
|
