|
The latest economic news paints a picture of U.S. economic growth moderating but remaining positive. Net, the numbers indicate that the odds of a double dip have receded. Earlier increases in oil prices bumped up headline numbers for inflation but the core trend is close to flat. Meanwhile, equities netted healthy gains.
 Most of the action in equities took place on Monday on wide-ranging economic news with major indexes up, ranging from up 0.8 percent to 2.5 percent for the day. A report on Chinese industrial production rising sharply in August put markets in a good mood. Bank stocks got a big lift from news that international regulations on capital requirements would be phased in over a longer time period than expected. This euphoria carried over into broad markets. Finally, acquisition activity provided additional support for equities as Hewlett-Packard announced an agreement to buy cyber-security firm ArcSight and Hertz boosted its offer for buying Dollar Thrifty Automotive. Most of the action in equities took place on Monday on wide-ranging economic news with major indexes up, ranging from up 0.8 percent to 2.5 percent for the day. A report on Chinese industrial production rising sharply in August put markets in a good mood. Bank stocks got a big lift from news that international regulations on capital requirements would be phased in over a longer time period than expected. This euphoria carried over into broad markets. Finally, acquisition activity provided additional support for equities as Hewlett-Packard announced an agreement to buy cyber-security firm ArcSight and Hertz boosted its offer for buying Dollar Thrifty Automotive.
Most equities slipped Tuesday on profit taking despite a better-than-expected retail sales report. Also, bank stocks were led down by talk that Bank of America might have to buy back as much as $20 billion in home loans originated from 2005 through 2007 with false or missing documentation. Stocks were up moderately on Wednesday despite small misses on the downside for industrial production (national) and Empire State manufacturing. Both reports, however, were positive. At mid-week, the factor behind the gains was mainly psychological as investors and traders focused on the cash stockpiles held by many companies. They concluded the cash will either fuel more acquisitions or be given back to stockholders.
Equities were little changed on Thursday except for a sharp dip by small caps. A positive was a small decrease in initial jobless claims which was more than offset by a negative Philly Fed report. Stocks posted gains on Friday despite an unexpected decline in consumer sentiment. The key reason for the gain was better-than-projected earnings at technology companies, including Research In Motion and Oracle.
Overall, healthy earnings and balance sheets for corporations (flush with cash) and moderate economic news have kept the September rally going.
Equities were up this past week. The Dow was up 1.4 percent; the S&P 500, up 1.4 percent; the Nasdaq, up 3.3 percent; and the Russell 2000, up 2.4 percent.
For the year-to-date, major indexes are up as follows: the Dow, up 1.7 percent; the S&P 500, up 0.9 percent; the Nasdaq, up 2.0 percent; and the Russell 2000, up 4.2 percent.
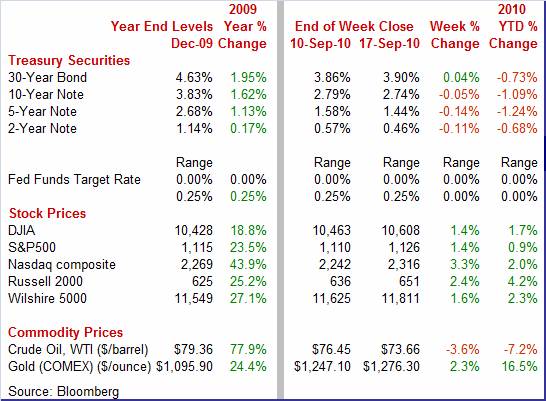
Weekly percent change column reflects percent changes for all components except interest rates. Interest rate changes are reflected in simple differences.
 Treasury yields ended the week down for most maturities. Rates eased Monday as the U.S. monthly fiscal deficit posted smaller than expected and the Fed bought $3.4 billion in U.S. debt. Some key strategists with investment management companies argued that the Fed is now embarked on a plan with quantitative easing to push Treasury rates back to levels seen in the 1950s. Treasury yields ended the week down for most maturities. Rates eased Monday as the U.S. monthly fiscal deficit posted smaller than expected and the Fed bought $3.4 billion in U.S. debt. Some key strategists with investment management companies argued that the Fed is now embarked on a plan with quantitative easing to push Treasury rates back to levels seen in the 1950s.
The increased belief that the Fed will continue to ease carried over to Tuesday trading as yields slipped further. JP Morgan Chase released results from a weekly poll of clients that the net percentage of investors taking long positions rose significantly in the latest week. Also, a Goldman Sachs economist indicated he believed the Fed would implement another round of quantitative easing.
Rates firmed a bit on Wednesday and Thursday. A primary reason was due to speculation that Japan would be buying Treasuries to slow the appreciation of the yen or even to bump it down a bit. Yields firmed despite disappointing news from Empire State and Philly Fed manufacturing reports.
For this past week Treasury rates were mostly down as follows: the 2-year note, down 11 basis points; the 5-year note, down 14 basis points; the 7-year note, down 9 basis points; and the 10-year bond, down 5 basis points. The 3-month T-bill was up 2 basis points while the 30-year bond firmed 4 basis points.
 The spot price for West Texas Intermediate fell moderately this past week. But it started in the other direction on Monday with crude rising on news of a jump in Chinese industrial production and after closure of a pipeline from Canada to U.S. refineries. The spot price for West Texas Intermediate fell moderately this past week. But it started in the other direction on Monday with crude rising on news of a jump in Chinese industrial production and after closure of a pipeline from Canada to U.S. refineries.
 But the trend the rest of the week was down. News on Tuesday of imminent finishing of repairs to the Canadian pipeline bumped prices back down. Downward pressure continued Wednesday when a federal official stated the pipeline would be allowed to restart. Japanese intervention—boosting the dollar—also weighed on oil prices. But the trend the rest of the week was down. News on Tuesday of imminent finishing of repairs to the Canadian pipeline bumped prices back down. Downward pressure continued Wednesday when a federal official stated the pipeline would be allowed to restart. Japanese intervention—boosting the dollar—also weighed on oil prices.
During the latter part of the week, disappointing economic news continued to nudge prices down. These included the Empire State manufacturing, Philly Fed manufacturing, and consumer sentiment.
Net for the week, spot prices for West Texas Intermediate dropped $2.79 per barrel to settle at 73.66.
Nonetheless, oil prices have largely been range bound in recent weeks between $70 and $80 per barrel.
With the deluge of economic news this past week, the best numbers actually came from the consumer sector. Unfortunately, the worst numbers also came from the consumer sector. Recent reports show manufacturing decelerating but likely still on an uptrend. On the inflation front, data were mixed but still showing a subdued path.
 The consumer sector is the biggest part of the economy, standing at roughly 70 percent of GDP, although the goods portion is only about 30 percent of that. Nonetheless, the key to economic growth is healthy consumer spending. The consumer sector is the biggest part of the economy, standing at roughly 70 percent of GDP, although the goods portion is only about 30 percent of that. Nonetheless, the key to economic growth is healthy consumer spending.
And the consumer sector appears to be doing its share to add to economic growth in the third quarter. Overall retail sales in August continued to improve, gaining 0.4 percent, following a 0.3 percent rebound in July. Excluding autos, sales increased 0.6 percent, following a 0.1 percent rise in July. Sales excluding autos and gasoline jumped 0.5 percent, following a 0.1 percent dip in July. The August numbers were a little better than expected but still at a moderate pace.
The rebound in July was led by a 1.9 percent gain in gasoline station sales with food & beverages up 1.3 percent and clothing up 1.2 percent. Also showing increases were health & personal care, sporting goods & hobby stores, general merchandise, nonstore retailers, and food services & drinking places.
Weakness was led by a 1.1 percent fall in electronics & appliances, a 0.9 percent decline in miscellaneous stores, and a 0.7 percent drop in motor vehicle & parts.
Occasionally, TV and web analysts lose track of key points about methodology. For those wondering if the boost was related to back to school spending, the numbers are seasonally adjusted and largely take that factor into account. But back-to-school spending may have been better than built into seasonal factors. This may be reflected in strong numbers for general merchandise and clothing.
The latest retail sales report adds ammunition to the argument that there will be no double dip. While the consumer sector still is at a pace somewhere between modest and moderate, the recent numbers are supporting a decent third quarter GDP figure. Nonetheless, question marks remain about the consumer sector.
 Despite a September rebound in stocks and a dip in initial unemployment claims, the mood of the consumer is not improving—and even slipped in September. The Reuters/University of Michigan consumer sentiment index for the mid-September reading fell 2.1 points to 66.6 to erase the gain made in August. The reading was the lowest since the 66.5 figure for July, a month when sentiment suddenly nose dived. Despite a September rebound in stocks and a dip in initial unemployment claims, the mood of the consumer is not improving—and even slipped in September. The Reuters/University of Michigan consumer sentiment index for the mid-September reading fell 2.1 points to 66.6 to erase the gain made in August. The reading was the lowest since the 66.5 figure for July, a month when sentiment suddenly nose dived.
Just as economists have downgraded their forecasts for the recovery, so have consumers. While the current conditions index for mid-September came in at 78.4 versus 78.3 for final August, the expectations index dropped to 59.1 from 62.9 in August. The latter is at its lowest reading of the recovery but at least somewhat above the recession low of 49.2.
Generally, the expectations index is a leading indicator for the economy—it is a component in the index of leading indicators. So, the question is whether consumer spending is going to ease ahead or not. This is a gray area since some pent up demand built up during the recession. Delayed purchases meant that many goods have simply worn out and need replacing. This will support spending to some degree and should keep spending from slipping much. But to get the really good numbers, more hiring will have to take place.
 Industrial production has been a key source of strength for the recovery. Overall industrial production in August rose 0.2 percent, following a 0.6 percent jump in July. The advance in August was in line with the median forecast for a 0.2 percent gain. Industrial production has been a key source of strength for the recovery. Overall industrial production in August rose 0.2 percent, following a 0.6 percent jump in July. The advance in August was in line with the median forecast for a 0.2 percent gain.
By components, manufacturing was less robust in the latest month, edging up 0.2 percent after a 0.7 percent boost in July. Damping manufacturing was a monthly 5.0 percent drop in output of motor vehicles & parts, following a 9.5 percent jump in July. The good news, however, is that outside of autos, manufacturing actually strengthened. Excluding motor vehicles, manufacturing gained 0.5 percent in August, following a 0.2 percent rise the month before.
Rounding out industry group components for the latest month, utilities output was down 1.5 percent while mining rose 1.2 percent.
 Capacity utilization improved slightly to 74.7 percent in August from 74.6 percent the month before. Analysts had forecast 74.9 percent for August.
Forward momentum is not as strong as a few months ago as growth in durables orders has been oscillating at a recent trend that is only modestly in positive territory. The bottom line is that manufacturing remains on an uptrend—especially after discounting volatility from auto assemblies.
 With national industrial production moderating, it should not be a surprise that the lower trajectory leaves manufacturing more likely to have some regions modestly positive and others slightly negative. That is the case for key readings in September. With national industrial production moderating, it should not be a surprise that the lower trajectory leaves manufacturing more likely to have some regions modestly positive and others slightly negative. That is the case for key readings in September.
The New York Fed’s Empire State Index eased to 4.14 from 7.10 in August. But for this survey, a diffusion index reading over zero indicates month-to-month growth with higher numbers reflecting more rapid growth.
 However, the best readings in the report were for new orders and for employment. Momentum for New York State manufacturing improved somewhat as the new orders index jumped to plus 4.33 from minus 2.71 in August. The employment index was positive at 14.93 – up from 14.29 in August and indicating moderate growth in manufacturing employment. However, the best readings in the report were for new orders and for employment. Momentum for New York State manufacturing improved somewhat as the new orders index jumped to plus 4.33 from minus 2.71 in August. The employment index was positive at 14.93 – up from 14.29 in August and indicating moderate growth in manufacturing employment.
The numbers were not so good in the latest Philly Fed manufacturing report.
The headline index for general business activity improved but remained in negative territory, coming in at minus 0.7, compared to minus 7.7 in August. But other parts of the report are somewhat more negative.
New orders, at minus 8.1, contracted for a third month and contracted at a deepening rate. Unfilled orders, at minus 8.5, extended their long run of contraction. Shipments, at minus 7.1, contracted for a second month as did the workweek. On the positive side was a slight gain for employment.
Overall, regional manufacturing is mixed for September, indicating the production at the national level will be plodding along for the near term.
 Sometimes it is difficult to interpret the impact of inventories on overall economic momentum. For any given recent numbers, meaning heavily depends on context. A rise in inventories with sales falling is far different than a rise in inventories with sales projected to rise. The same holds true whether a gain in inventories is leading to excessive stocks or merely replenishing empty shelves. We are in a possible gray area currently. Sometimes it is difficult to interpret the impact of inventories on overall economic momentum. For any given recent numbers, meaning heavily depends on context. A rise in inventories with sales falling is far different than a rise in inventories with sales projected to rise. The same holds true whether a gain in inventories is leading to excessive stocks or merely replenishing empty shelves. We are in a possible gray area currently.
Business inventories, up 1.0 percent in July, rose significantly for a second month and outpaced sales for a second month. The build was broad, up 1.3 percent at wholesalers, up 1.0 percent at manufacturers, up 0.7 percent at retailers. The build for retailers was skewed by a second straight giant build at auto dealers.
Does the recent string of inventory gains indicate that producers are about to cut back on production due to inventory overhang' This probably is not yet a problem.
Outside of car dealers, the latest retail sales report was mostly upbeat for August meaning that excess inventory is not a risk right now for retailers. Inventories do appear to be heavy in the wholesale sector where sales are flat. But wholesaler inventories are mostly imports and cutting back there would not hurt domestic producers much.
For a broader picture, inventory levels are not excessive. Gains are still moderate relative to the sharp drawdown during the recession. Notably, the inventory-to-sales ratio is still low. Unless business sales fall over a cliff, there currently is not much risk to the economy from any pending inventory adjustment.
 Despite a relatively strong overall CPI for August, it looks like the Fed will want to maintain quantitative easing to help ensure the economy does not slip back into recession and even a period of deflation. The overall CPI in August posted a 0.3 percent rise, equaling the boost in July and matching the median forecast. Excluding food and energy, CPI inflation slowed to no change (after being rounded down), coming in below analysts’ expectations for a 0.1 percent rise. Playing a key role in softening the core rate was an unchanged shelter index. Despite a relatively strong overall CPI for August, it looks like the Fed will want to maintain quantitative easing to help ensure the economy does not slip back into recession and even a period of deflation. The overall CPI in August posted a 0.3 percent rise, equaling the boost in July and matching the median forecast. Excluding food and energy, CPI inflation slowed to no change (after being rounded down), coming in below analysts’ expectations for a 0.1 percent rise. Playing a key role in softening the core rate was an unchanged shelter index.
 The upward pressure at the headline level came mainly from energy which jumped 2.3 percent, following a 2.6 percent boost in July. Gasoline rose another 3.9 percent after a 4.6 percent gain the previous month. Food prices rebounded 0.2 percent after dipping 0.1 percent in July. The upward pressure at the headline level came mainly from energy which jumped 2.3 percent, following a 2.6 percent boost in July. Gasoline rose another 3.9 percent after a 4.6 percent gain the previous month. Food prices rebounded 0.2 percent after dipping 0.1 percent in July.
 In the core, shelter costs continued to stand out—as weak. Just when you thought they could not get softer, they did. Shelter costs were flat in August after rising only 0.1 percent in each of the prior fourth months. Again, this reflects the weak housing market and also a sluggish travel market for lodging while away from home. Shelter costs are so weak that on a year-ago basis they were down 0.5 percent in August. In the core, shelter costs continued to stand out—as weak. Just when you thought they could not get softer, they did. Shelter costs were flat in August after rising only 0.1 percent in each of the prior fourth months. Again, this reflects the weak housing market and also a sluggish travel market for lodging while away from home. Shelter costs are so weak that on a year-ago basis they were down 0.5 percent in August.
Actual monthly declines were seen in apparel and in recreation, down 0.1 percent and 0.2 percent, respectively for August. Medical care rebounded 0.2 percent after slipping 0.1 percent in July.
For now, the Fed has little to worry about on the inflation front. At this point, deflation risk may be more of a concern that inflation. Year-on-year, overall CPI inflation slipped to 1.2 percent (seasonally adjusted) from 1.3 percent in July. The core rate in August was steady at 1.0 percent. These numbers are well below the bottom of the Fed’s implicit target range for inflation of 1-1/2 to 2 percent for the PCE price index. Because of methodology differences, CPI inflation tends to run about a third percentage point higher than the PCE price index.
Overall, price pressures are nearly nonexistent outside of energy. If you believe the recent gains in energy costs are temporary, then the inflation picture currently is quite good.
 As with the CPI, higher energy costs resulted in a strong headline for the PPI. The overall PPI accelerated to a 0.4 percent gain in August from 0.2 percent in July. In contrast, at the core level the PPI eased to a 0.1 percent gain from a 0.3 percent boost in July. The August core matched expectations. As with the CPI, higher energy costs resulted in a strong headline for the PPI. The overall PPI accelerated to a 0.4 percent gain in August from 0.2 percent in July. In contrast, at the core level the PPI eased to a 0.1 percent gain from a 0.3 percent boost in July. The August core matched expectations.
Looking at key broad components, energy surged 2.2 percent after a 0.9 percent decrease the month before. For August, home heating oil increased 7.0 percent while gasoline jumped 7.5 percent. Meanwhile, food prices eased, declining 0.3 percent, following a 0.7 percent jump in July. The decline in food prices was led by a 4.7 percent drop in the price for fresh eggs as consumers kept away from this product tainted by salmonella in some shipments from two producers.
Softening the core rate was a 0.4 percent decline in passenger car prices along with scattered slippage in prices of various other components. Providing upward pressure were a 0.6 percent boost in pharmaceuticals and a 0.2 percent rise in prices for light trucks.
Outside of energy, PPI inflation is tame. One a year-ago basis, the core rate eased to 1.3 percent from 1.5 percent the prior month (seasonally adjusted basis). Again, a key question is whether the rise in energy costs is a trend or a blip. With modest economic growth in the U.S. and Europe, odds are that it is closer to a blip than a trend.
Data were mixed this past week but still suggest modest to moderate growth ahead. One, however, should not expect a smooth path. Underlying inflation remains quite soft.
Analysts will be looking to see if housing starts continue to firm Tuesday morning. Again on Tuesday, analysts will await the FOMC's statement in the afternoon. Fed watchers will be looking for guidance on the Fed's plans for its balance sheet. Updates for existing and for new home sales print Thursday and Friday. But manufacturing likely will be the focus at week’s end with the durable orders release.
Housing starts in July posted a modest comeback, rising 1.7 percent after an 8.7 percent decrease in June. The July annualized pace of 0.546 million units was down 7.0 percent on a year-ago basis. In fact, the latest number is also down fractionally from the initial June estimate of 0.549. That is, July would have been a decline instead of a rebound was it not for a downward revision to June. Overall building permits fell back 3.1 percent in July, following a 1.6 percent rebound in June. Overall permits stood at an annualized rate of 0.565 million units and were down 3.7 percent on a year-ago basis. Looking ahead, starts are still under pressure from excessive supply. New homes on the market rose to 9.1 months in July.
Housing starts Consensus Forecast for August 10: 0.550 million-unit rate
Range: 0.520 million to 0.575 million-unit rate
The FOMC announcement for the September 21 FOMC policy meeting is expected to leave the fed funds target rate unchanged at a range of zero to 0.25 percent. The big question is whether any additional quantitative easing measures will be announced. Also, analysts look for signs of dissent over the timing of changes in the Fed’s balance sheet as well as the size of changes and even the planned composition of assets (mainly Treasuries versus non-Treasury assets).
FOMC Consensus Forecast for 9/21/10 policy vote on fed funds target range: unchanged at a range of zero to 0.25 percent
Initial jobless claims for the September 11 week dipped 3,000 to 450,000 for the lowest total since July. The four-week average posted its sharpest decrease of the year, down 13,500 to a 464,750 level that is about 20,000 lower than mid-month August. However, the latest claims may have been affected by the shortened Labor Day week. Weekly seasonal adjustment is less reliable than monthly—there is more volatility in the underlying numbers.
Jobless Claims Consensus Forecast for 9/18/10: 450,000
Range: 445,000 to 475,000
Existing home sales plunged a monthly 27.2 percent in July to a 3.83 million annual rate for the lowest level in 15 years. This was in sharp contrast to the recent high of 6.49 million annualized units in November 2009 and 5.79 million units in April of this year. These two months were boosted, however, by deadlines to qualify for special tax credits for homebuyers. Clearly, many home purchases were moved forward to claim the tax credits, leaving a gap in demand after the incentives ended. Looking ahead, we might see further improvement in August for existing home as pending home sales (based on contract signings) rebounded 5.2 percent in July and some of those will close in August.
Existing home sales Consensus Forecast for August 10: 4.05 million-unit rate
Range: 3.87 to 4.50 million-unit rate
The Conference Board's index of leading indicators made a modest comeback in July, suggesting that forward momentum for the economy continues. The index of leading economic indicators rose 0.1 percent in July after dipping 0.3 percent the month before. A positive in the latest leading indicators report was a 0.2 percent rise in the coincident index which more than reversed June's 0.1 percent drop. This suggests that the economy is not now in recession but merely in a slow growth period.
Leading indicators Consensus Forecast for August 10: +0.1 percent
Range: -0.2 to +0.2 percent
Durable goods orders in July rebounded a revised 0.4 percent, following a 0.2 percent decline the prior month. Unfortunately, strength is narrowly focused for the month. Most of new orders strength came from transportation which jumped a revised 12.9 percent, following a 1.1 percent decrease in June. Nondefense aircraft spiked 75.9 percent after falling 25.3 percent in June. Most other components slipped. Excluding transportation, new durables orders dropped a revised 3.7 percent, following a 0.2 percent rise in June. Looking ahead, precursor indicators on orders are mixed. The ISM new orders index for August was barely in positive territory at 52.4 (breakeven of 50). For the same period, the Philly Fed and New York Fed new orders indexes were both negative at minus 7.1 and minus 2.7, respectively (breakeven of zero). However, the manufacturing survey indexes include nondurables in addition to durables.
New orders for durable goods Consensus Forecast for August 10: -1.0 percent
Range: -2.5 percent to +2.0 percent
New home sales fell 12.4 percent in July to a record low 276,000 unit annual rate for a series that goes back to 1963. This compares to recent highs of 408,000 in July 2009 and 414,000 in April of this year. Supply rose steeply, to 9.1 months from June's 8.0 months. Looking ahead, early indications are not good. The National Association of Homebuilders Housing Market Index was very weak in July and August—especially for traffic viewing homes.
New home sales Consensus Forecast for August 10: 290 thousand-unit annual rate
Range: 275 thousand to 320 thousand-unit annual rate
R. Mark Rogers is the author of The Complete Idiot’s Guide to Economic Indicators, Penguin Books, October 2009.
Econoday Senior Writer Mark Pender contributed to this article.
|
