|
The good news is that equities were mostly steady net for the holiday shortened week as there was little news to create significant upward or downward momentum. But for stocks, mixed and mostly little changed actually are good after the prior week’s large boost.
 The bears claimed that stocks were a little too euphoric heading into the Labor Day weekend as that week netted sharp gains. It would not have been much of a surprise to see some pullback this week. But the limited economic news supported maintaining equities at current levels. The bears claimed that stocks were a little too euphoric heading into the Labor Day weekend as that week netted sharp gains. It would not have been much of a surprise to see some pullback this week. But the limited economic news supported maintaining equities at current levels.
Equities started the week on Tuesday, however, with a sizeable dip. A Wall Street journal article, reporting its own analysis of the stress tests of certain European banks, claimed that the stress tests were too easy and understated some banks’ holdings of risky sovereign debt. Bank stocks led equities down in Europe as well as the U.S.
But stocks began a three day rally on Wednesday as news from Europe was actually encouraging. A successful Portuguese debt auction eased doubts over the ability of Europe to continue to move forward from the sovereign debt crisis. The Fed’s Beige Book did confirm a slowing in U.S. growth but was positive enough to indicate that a double dip recession is not in the works—merely temporarily slow growth.
Equities got a boost on Thursday from an unexpected drop in initial jobless claims along with a rebound in U.S. exports. However, the impact of the jobless number was limited by concerns that the dip was artificial and related to the week heading into the long holiday weekend as laid off workers may have delayed filing claims until the following week.
Stocks posted another gain on Friday from a rare source of movement—the wholesale trade report. Inventories jumped 1.3 percent for July and markets chose to see the number as a sign that businesses are optimistic about future sales. While this was the market interpretation, it also could be that the inventory boost was unwanted. Nonetheless, it was a day for rose colored glasses as the end of week gain left most indexes back into positive territory for the week, albeit not by much. Trading volume was light all week as many remained on holiday.
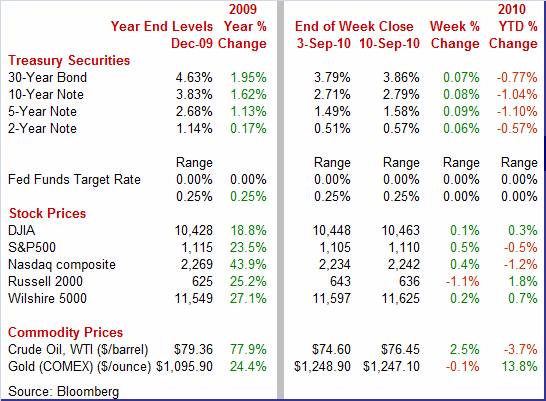
Equities were mostly up this past week. The Dow was up 0.1 percent; the S&P 500, up 0.5 percent; and the Nasdaq, up 0.4 percent. The notable exception was the Russell 2000, down 1.1 percent, but this index had one of the sharpest gains the prior week.
For the year-to-date, major indexes are mixed as follows: the Dow, up 0.3 percent; the S&P 500, down 0.5 percent; the Nasdaq, down 1.2 percent; and the Russell 2000, up 1.8 percent.
Weekly percent change column reflects percent changes for all components except interest rates. Interest rate changes are reflected in simple differences.
 Treasury yields closely tracked the stock market, falling and rising for many of the same reasons. Worries over European banks and not-so-stressful stress tests led to flight to safety into Treasuries on Tuesday. Rates firmed the rest of the week on the successful Portuguese bond auction, moderate Beige Book, dip in jobless claims, and Friday’s jump in equities on a rosy view of a rise in wholesaler inventories. Treasury yields closely tracked the stock market, falling and rising for many of the same reasons. Worries over European banks and not-so-stressful stress tests led to flight to safety into Treasuries on Tuesday. Rates firmed the rest of the week on the successful Portuguese bond auction, moderate Beige Book, dip in jobless claims, and Friday’s jump in equities on a rosy view of a rise in wholesaler inventories.
For this past week Treasury rates were up as follows: 3-month T-bill, up 2 basis points; the 2-year note, up 6 basis points; the 5-year note, up 9 basis points; the 7-year note, up 9 basis points; the 10-year bond, up 8 basis points; and the 30-year bond, up 7 basis points.
 The spot price for West Texas Intermediate posted a modest gain for the week. The oil market was lackluster until the end of the week. There were modest moves on Tuesday and Wednesday as oil fell and rose with equities. Crude dipped on Thursday—but only slightly—as the holiday delayed inventory report showed petroleum inventories at the highest level since at least 1990. But on Friday, crude jumped over $2 per barrel on news that a key Canadian pipeline to refineries in the U.S. Midwest was closed due to a leak. Also, a report out of China indicated a jump in imports of crude oil by that country The spot price for West Texas Intermediate posted a modest gain for the week. The oil market was lackluster until the end of the week. There were modest moves on Tuesday and Wednesday as oil fell and rose with equities. Crude dipped on Thursday—but only slightly—as the holiday delayed inventory report showed petroleum inventories at the highest level since at least 1990. But on Friday, crude jumped over $2 per barrel on news that a key Canadian pipeline to refineries in the U.S. Midwest was closed due to a leak. Also, a report out of China indicated a jump in imports of crude oil by that country
Net for the week, spot prices for West Texas Intermediate advanced $1.43 per barrel to settle at $76.45.
Economic news was sparse this week. The highlight was a boost in exports for the U.S.
 Despite some oscillations in the monthly numbers, U.S. exports are on an uptrend. The latest rebound in exports—along with a dip in imports—reduced the July trade deficit significantly. The overall U.S. trade deficit narrowed to $42.8 billion from $49.8 billion in June. The latest shortfall was much smaller than the consensus forecast for a $46.8 billion deficit. Despite some oscillations in the monthly numbers, U.S. exports are on an uptrend. The latest rebound in exports—along with a dip in imports—reduced the July trade deficit significantly. The overall U.S. trade deficit narrowed to $42.8 billion from $49.8 billion in June. The latest shortfall was much smaller than the consensus forecast for a $46.8 billion deficit.
Exports rebounded 1.8 percent, following a 1.3 percent decline in June. Overall imports declined 2.1 percent after increasing 3.1 percent the prior month. Nonoil imports fell 3.0 percent, following a 4.6 percent jump in June.
The improvement in the trade gap was largely seen in the nonpetroleum deficit which shrank to $33.2 billion in July from $39.7 billion the prior month. The petroleum goods gap also improved, narrowing to $20.9 billion from $21.3 billion in June.
Where is U.S. export strength' The U.S. trade advantage currently is in capital goods. By end-use categories, the boost in goods exports was led by a $2.3 billion jump in capital goods excluding autos. A large part of this--$1.4 billion—was civilian aircraft. This still left a moderately sizeable $0.9 billion outside of aircraft. Also gaining were industrial supplies, up $0.5 billion. Automotive exports were down $0.4 billion. The feeds & beverages and consumer goods ex autos components were essentially unchanged though down negligibly.
 The drop in imports was broad based though following a large overall increase in June. Consumer goods fell $1.9 billion; autos were down $0.7 billion; capital goods ex autos declined $0.6 billion; and industrial supplies—which include oil—slipped $0.4 billion. Foods, feeds & beverages edged down $0.1 billion. The drop in imports was broad based though following a large overall increase in June. Consumer goods fell $1.9 billion; autos were down $0.7 billion; capital goods ex autos declined $0.6 billion; and industrial supplies—which include oil—slipped $0.4 billion. Foods, feeds & beverages edged down $0.1 billion.
The import numbers may be telling us several things. First, businesses may be lowering expectations on consumer spending in the U.S. as they bumped down imports of consumer goods. But that dip did follow a strong gain in consumer goods imports in June. The decline in auto imports may simply mean that auto dealer inventory restocking may be about where they want. Swings in auto imports often reflect changes in how many Canadian produced U.S. nameplates are driven over the border to U.S. dealers. Finally, U.S. businesses appear to be nudging down plans for investing in equipment as non-auto capital goods imports slipped.
The latest report is good news for adding a little lift to third quarter GDP growth. In real dollars, the July deficit stood at $47.7 billion, down from June’s 53.6 billion and from the second quarter average of $47.9 billion. And manufacturers certainly will be happy about the resumption of export growth.
 Deleveraging in the consumer sector continues. Consumer credit contracted once again, down $3.6 billion in July to extend the latest string of declines to six months. Deleveraging in the consumer sector continues. Consumer credit contracted once again, down $3.6 billion in July to extend the latest string of declines to six months.
Revolving credit (mainly credit cards) fell $4.4 billion, offset in part by a $0.8 billion rise in nonrevolving credit (largely auto financing) that got a boost from July's strength in car sales.
The downtrend in consumer credit outstanding actually goes back to August 2008 as the recession worsened and credit markets were seizing up. Thanks to the Fed’s low interest rate policy, Fed assistance to financial institutions through special lending facilities, and generally improved economic conditions, lending conditions have improved though still remain somewhat restrictive (tighter lending standards).
There are at least a couple of long-term trends going on in the data. Credit outstanding is down partly due to consumers apparently recognizing that running up credit card debt is a bad idea. Consumers have been paying down credit card debt and have been spending out of actual income. On the flip side, banks were too loose in expanding credit and are still paying for that policy prior to the credit crunch. Banks are still writing off bad debt but not as rapidly as before. Charge offs are adding to the downtrend in consumer credit outstanding.
Although these trends are good for the long-term (spending being based on actual income), the softness in consumer credit is keeping the recovery sluggish. But these psychological shifts and new lending standards are not likely to change anytime soon. Consumer spending is increasingly tied to income gains. To get consumer spending up, it is going to require additional income and that depends on employment gains.
According to the Federal Reserve’s Beige Book, the recovery continues— but at a slower pace. Five of the 12 regional banks reported moderately paced economic growth and two pointed to “positive developments or net improvements.” The remaining five banks said conditions were mixed or decelerating. Overall, the latest Fed Beige Book finds the economy with “continued growth” but “with widespread signs of a deceleration.” Growth is described as “at a modest pace.” Still, there is no talk of a double dip.
The good news is that “Consumer spending appeared to increase on balance despite continued consumer caution that limited nonessential purchases.”
Also, manufacturing continues to add to economic growth. “Reports on manufacturing activity pointed to further expansion, although the pace of growth eased according to several Districts.”
Within manufacturing, weakness was largely related to construction while strength was in auto-related production, including production of steel. Some Districts reported that export demand was an important contributor to healthy manufacturing conditions.
No surprise, housing is down and nonresidential construction is weak. “Home sales slowed further following an initial drop after the expiration of the homebuyer tax credit at the end of June, prompting a slowdown in construction activity as well. Demand for commercial real estate remained quite weak but showed signs of stabilization in some areas.”
Inflation is still subdued but the Beige Book mentions some isolated sources of inflation pressures—including for specialized workers.
“Upward price pressures remained quite limited for most categories of final goods and services, despite higher prices for selected commodities such as grains and some industrial materials. Wage pressures also were limited, although a few Districts noted increased upward pressures in a narrow set of sectors experiencing a mismatch between job requirements and applicant skills.”
Overall, the latest Beige Book was in line with many analysts’ and economists’ view that the recovery is temporarily slowing but not falling back into recession.
The U.S. economy is continuing to get support from exports. However, the consumer sector remains sub-par relative to past recoveries due to a major shift in attitudes about debt as consumers continue to deleverage. Still, there is no convincing evidence of a double dip with corroboration coming from the latest Beige Book.
Traders get to reevaluate trends in manufacturing and consumer sectors as well as inflation pressures. Industrial production and Empire State post on Wednesday while Philly Fed hits the wires Thursday. Retail sales will highlight on Tuesday, followed by consumer sentiment on Friday. Import prices, PPI, and CPI release on each of the last three days of the week.
The U.S. Treasury monthly budget report for July showed a deficit of $165.0 billion compared last July's $180.7 billion. The fiscal year-to-date deficit came in at $1.20 trillion vs. $1.42 trillion the same time last year. Tax receipts are coming up short of estimates but are being offset by Federal Reserve remittances, which are at a year-to-date $61 billion vs. $21 billion a year-ago. Looking ahead, the month of August typically shows a deficit for the month. Over the past 10 years, the average deficit for the month of August has been $71.1 billion and $89.6 billion over the past five years. The August 2009 shortfall came in at $103.6 billion.
Treasury Statement Consensus Forecast for August 10: -$95.0 billion
Range: -$120.0 billion to -$95.0 billion.
Retail sales in July rebounded 0.4 percent, following a 0.3 percent decrease in June. However, a large part of the strength came from the auto component. Excluding autos, sales gained a more modest 0.2 percent, following a 0.1 percent downtick in June. Certainly, the boost in auto sales was a positive, but the other source of strength - a spike in gasoline sales – likely was lifted by higher prices rather than higher demand. Without the jump in gasoline sales, consumer spending was soft. Sales excluding autos and gasoline slipped 0.1 percent, following a 0.2 percent boost in June. Looking ahead, unit new motor vehicle sales in August were down 0.6 percent. But price changes could overwhelm such a modest unit change—either bumping that up to a gain in the retail sales report or making the drop larger. And chain store sales were somewhat favorable.
Retail sales Consensus Forecast for August 10: +0.3 percent
Range: +0.1 to +0.5 percent
Retail sales excluding motor vehicles Consensus Forecast for August 10: +0.4 percent
Range: +0.2 to +0.6 percent
Business inventories rose 0.3 percent in June while business sales dropped 0.6 percent. Inventories for the retail component jumped 0.8 percent but reflected a 3.2 percent build for autos & parts. For this component, the build was necessary given strong incentive-driven sales evident July retail sales. Excluding autos, retail inventories were unchanged. Looking ahead, factory inventories jumped 1.0 percent in July while wholesaler inventories increased 1.3 percent, indicating overall inventories are likely to be up sharply for the month.
Business inventories Consensus Forecast for July 10: +0.6 percent
Range: +0.4 to +0.9 percent
The Empire State manufacturing index in August was positive at 7.1, rising 2 points from July. But details suggest slowing ahead, indicating that September may not be as strong as August. The new orders index fell into negative territory for the first time in more than a year, dropping to minus 2.7 from plus 10.1 in July. The unfilled orders and shipments were also negative.
Empire State Manufacturing Survey Consensus Forecast for September 10: 5.0
Range: 2.0 to 9.0
Industrial production in July jumped 1.0 percent, following a revised 0.1 percent down tick in June. By components, manufacturing posted a 1.1 percent comeback, following a 0.5 percent decline in June. Rounding out industry group components for July, utilities output was up 0.1 percent while mining advanced 0.9 percent. One sector that clearly is holding its own and even strengthening is the auto sector. Assemblies of autos and light trucks jumped to an 8.4 million unit pace in July from 7.4 million the month before. Capacity utilization improved to 74.8 percent in July from 74.1 percent the prior month. Looking ahead, warning signs are mixed on August output. Production worker hours were unchanged in August in the employment situation. The ISM manufacturing index came in modestly positive at 56.3 (breakeven of 50). Meanwhile, key regional indexes were on opposite sides of breakeven with Empire State at 7.1 and Philly Fed at negative 7.7 (breakeven of zero for both).
Industrial production Consensus Forecast for August 10: +0.2 percent
Range: 0.0 to +0.5 percent
Capacity utilization Consensus Forecast for August 10: 74.9 percent
Range: 74.8 to 75.2 percent
The producer price index in July rebounded 0.2 percent, following a 0.5 percent fall in June. At the core level, the PPI gained 0.3 percent, following a 0.1 percent uptick in June. For the latest month, energy costs posted a 0.9 percent decrease. Meanwhile, food prices jumped 0.7 percent. Bumping the core rate up were notable price gains for light trucks, autos, and pharmaceuticals.
PPI Consensus Forecast for August 10: +0.3 percent
Range: +0.1 to +0.9 percent
PPI ex food & energy Consensus Forecast for August 10: +0.1 percent
Range: 0.0 to +0.7 percent
Initial jobless claims fell substantially in the September 4 week, dropping 27,000 to 451,000. This is the lowest level since July and the second lowest since May. The four-week average fell nearly 10,000 to 477,750 and is only slightly higher than a month-ago. Continuing claims showed only fractional change for a second week, at 4.478 million in data for the August 28 week with the four-week average at 4.488 million. But there is a significant caveat regarding the improvement in initial claims—it may have been partially due to leading into a holiday weekend. Workers laid off that week may have waited to file a claim until the next week. If there is not a significant bounce in claims for the September 11 week, that news will be confirmation that the September 4 drop was mostly real.
Jobless Claims Consensus Forecast for 9/11/10: 455,000
Range: 450,000 to 481,000
The general business conditions index of the Philadelphia Fed's Business Outlook Survey for August fell to minus 7.7 from plus 4.1 in July to indicate month-to-month contraction in business activity. Looking ahead, prospects are not good for September in the mid-Atlantic. The new orders index was in negative territory for the second month in a row, posting at minus 7.1 and worsening from July’s minus 4.3. Also, unfilled orders extended a run of declines.
Philadelphia Fed survey Consensus Forecast for September 10: 3.8
Range: -5.0 to 5.0
Quadruple Witching
The consumer price index in July rebounded 0.3 percent, following a 0.1 percent decline in June. Excluding food and energy, the CPI eased to a 0.1 percent gain after a 0.2 percent boost in June. By components, energy increased 2.6 percent, following a 2.9 percent drop in June. Food prices dipped 0.1 percent after being flat the prior two months. Within the core, shelter costs rose only 0.1 percent for the fourth month in a row.
CPI Consensus Forecast for August 10: +0.3 percent
Range: +0.2 to +0.4 percent
CPI ex food & energy Consensus Forecast for August 10: +0.1 percent
Range: 0.0 to +0.1 percent
The Reuter's/University of Michigan's Consumer sentiment index worsened in late August, dropping seven tenths from the mid-month reading to a final August reading of 68.9. Because the survey sample is about evenly divided between the first half of the month and the second half, the implied reading for the second half of the month is 68.2, barely ahead of July's final reading of 67.8. Weakness the last half of the month was centered in expectations.
Consumer sentiment Consensus Forecast for preliminary September 10: 70.0
Range: 68.0 to 71.0
R. Mark Rogers is the author of The Complete Idiot’s Guide to Economic Indicators, Penguin Books, October 2009.
Econoday Senior Writer Mark Pender contributed to this article.
|
