|
The big question in recent months has been whether the economy is headed back into recession or not. The latest employment report and other indicators suggest that the economy has dodged the double dip bullet. It’s not another recession but notably slow growth for now.
 Traders and investors took a more optimistic view of economic news as equities were up sharply for the week and some indexes even ended back in positive territory for the year. But it did not start that way. On Monday, the focus was on the headline number for personal income which fell short of expectations, bumping stocks down. Detail in that report that showed strong earnings growth was either missed or ignored. Stocks were little changed on Tuesday as better-than-expected figures for the Case-Shiller house price index, Chicago PMI, and consumer confidence were offset by what was viewed as negative FOMC minutes. Traders and investors took a more optimistic view of economic news as equities were up sharply for the week and some indexes even ended back in positive territory for the year. But it did not start that way. On Monday, the focus was on the headline number for personal income which fell short of expectations, bumping stocks down. Detail in that report that showed strong earnings growth was either missed or ignored. Stocks were little changed on Tuesday as better-than-expected figures for the Case-Shiller house price index, Chicago PMI, and consumer confidence were offset by what was viewed as negative FOMC minutes.
 Equities spiked on Wednesday as a below expectations ADP employment report was ignored and traders latched onto a positive ISM manufacturing report. Earlier, a Chinese report on strong manufacturing there lifted equities in Asia with the positive mood carrying over to Europe and the U.S. On Thursday, several reports boosted stocks, including lower initial jobless claims, an unexpected rebound in pending home sales, and healthier than projected chain store sales for August. Friday’s employment situation posted a better than expected rise in private employment and in wage growth, boosting stocks on the last trading day before the Labor Day holiday. Equities spiked on Wednesday as a below expectations ADP employment report was ignored and traders latched onto a positive ISM manufacturing report. Earlier, a Chinese report on strong manufacturing there lifted equities in Asia with the positive mood carrying over to Europe and the U.S. On Thursday, several reports boosted stocks, including lower initial jobless claims, an unexpected rebound in pending home sales, and healthier than projected chain store sales for August. Friday’s employment situation posted a better than expected rise in private employment and in wage growth, boosting stocks on the last trading day before the Labor Day holiday.
Merger mania also supported stocks during the week with a number of deals being announced, including the acquisition of Burger King by 3G Capital Group and with Hewlett-Packard winning the competition against Dell to buy 3Par.
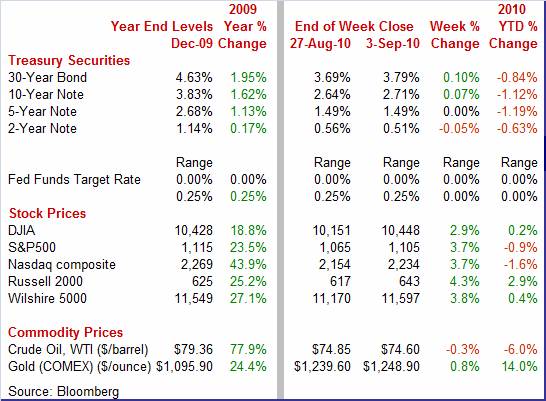
Equities were up sharply this past week, ending a three-week losing streak. The Dow was up 2.9 percent; the S&P 500, up 3.7 percent; the Nasdaq, up 3.7 percent; and the Russell 2000, up 4.3 percent.
Traders and investors certainly were glad to see August come to an end. Equities were down sharply for the month. The Dow was down 4.3 percent; the S&P 500, down 4.7 percent; the Nasdaq, down 6.2 percent; and the Russell 2000, down 7.5 percent.
For the year-to-date, major indexes are mixed as follows: the Dow, up 0.2 percent; the S&P 500, down 0.9 percent; the Nasdaq, down 1.6 percent; and the Russell 2000, up 2.9 percent.
Weekly percent change column reflects percent changes for all components except interest rates. Interest rate changes are reflected in simple differences.
 Treasury yields were mixed but mostly up this past week. Rates tracked economic news, easing on weak data on Monday and Tuesday and firming the last three days of the week on healthier economic indicators. During the latter part of the week rate increases also reflected funds moving into equities on reversal of flight to safety. Treasury yields were mixed but mostly up this past week. Rates tracked economic news, easing on weak data on Monday and Tuesday and firming the last three days of the week on healthier economic indicators. During the latter part of the week rate increases also reflected funds moving into equities on reversal of flight to safety.
 For this past week Treasury rates were mixed with long rates up and the near end down: 3-month T-bill, down 2 basis points; the 2-year note, down 5 basis points; the 5-year note, unchanged; the 7-year note, up 4 basis points; the 10-year bond, up 7 basis points; and the 30-year bond, up 7 basis points. For this past week Treasury rates were mixed with long rates up and the near end down: 3-month T-bill, down 2 basis points; the 2-year note, down 5 basis points; the 5-year note, unchanged; the 7-year note, up 4 basis points; the 10-year bond, up 7 basis points; and the 30-year bond, up 7 basis points.
Rates still remain on a downtrend as the long bond and 10-year T-bond have dropped significantly since early spring of this year when economic news was the strongest. Partly bringing longer rates down has been the new Fed policy of reinvesting pay downs on agency debt and mortgage-backed securities in its balance sheet into Treasuries in the 2-year to 10-year maturity range.
 The spot price for crude oil ended the week essentially unchanged net with a couple of days of notable intraweek movement. West Texas Intermediate dropped $2-3/4 on Tuesday as weather forecasters had Hurricane Earl hitting the mid-Atlantic and Northeastern states on the start of the Labor Day weekend, likely cutting into demand for gasoline as vacationers were expected to stay home. But crude rebounded a little over two bucks on Wednesday on strong manufacturing surveys for China and the U.S. The slight curiousity for the week was a modest dip in prices on Friday as oil traders—in contrast to traders in other markets—focused on a weak non-manufacturing ISM instead of the better-than-expected jobs report. The spot price for crude oil ended the week essentially unchanged net with a couple of days of notable intraweek movement. West Texas Intermediate dropped $2-3/4 on Tuesday as weather forecasters had Hurricane Earl hitting the mid-Atlantic and Northeastern states on the start of the Labor Day weekend, likely cutting into demand for gasoline as vacationers were expected to stay home. But crude rebounded a little over two bucks on Wednesday on strong manufacturing surveys for China and the U.S. The slight curiousity for the week was a modest dip in prices on Friday as oil traders—in contrast to traders in other markets—focused on a weak non-manufacturing ISM instead of the better-than-expected jobs report.
Net for the week, spot prices for West Texas Intermediate nudged down 25 cents per barrel to settle at $74.60.
The latest round of indicators provided ironic relief—the economy is “only” in a slow growth phase instead of back in recession.
 The recent economic debate has largely been over whether we are headed for a double dip recession or something else. The answer, based on the August employment report, appears to be something else—growth recession—growth below long-term potential. The recent economic debate has largely been over whether we are headed for a double dip recession or something else. The answer, based on the August employment report, appears to be something else—growth recession—growth below long-term potential.
Overall payroll employment fell for the third straight month but there was a moderate gain in the private sector. Overall payroll jobs in August slipped 54,000 after falling a revised 54,000 in July (yes, they are the same) and contracting 175,000 in June. The June and July revisions were net up 123,000.
A big part of the latest month’s weakness was seen in the government sector, which still included layoffs of temporary Census workers. Government jobs dropped 121,000 after falling 161,000 in July. For the August drop, 114,000 were due to layoffs of temporary Census workers.
In contrast, private nonfarm employment continued to rise, gaining 67,000 in August, following a revised boost of 107,000 the month before. July had previously been estimated to be a 71,000 increase. Private nonfarm payroll jobs have risen for eight consecutive months. However, the pace of the increases has slowed compared to relatively strong increases of 241,000 in April and 158,000 in March.
Looking at private sector components, private service providing jobs rose 67,000 after a 70,000 boost in July. Leading the way was a 45,000 boost in education & health services, with health care up 40,000. Professional & business services returned to positive territory, rising 20,000 after dipping 3,000 in July. For the latest month temp help was up 17,000. Some weakness was seen in retail trade, down 5,000 in August.
Goods-producing jobs were unchanged in August after a 37,000 advance in July. In the goods-producing sector, manufacturing fell 27,000 with 22,000 of this accounted for in motor vehicles. This may be partly related to atypical seasonals in retooling timing this year. Construction jobs actually rebounded 19,000 after dipping 4,000 in July. Mining rose 8,000.
 Average hourly earnings improved to 0.3 percent from up 0.2 percent in July. The August number topped the market estimate for a 0.1 percent gain. The average workweek for all workers was unchanged at 34.2 hours in July. The market forecast was for 34.2 hours. Average hourly earnings improved to 0.3 percent from up 0.2 percent in July. The August number topped the market estimate for a 0.1 percent gain. The average workweek for all workers was unchanged at 34.2 hours in July. The market forecast was for 34.2 hours.
The latest employment report is favorable toward giving consumer spending a moderate boost. Looking ahead to the personal income report, aggregate weekly earnings were favorable toward a moderately healthy wages & salaries component. Aggregate weekly earnings rose 0.3 percent in August, following a 0.6 percent gain the month before. This means improvement in take home pay checks for the average worker.
Turning to the household survey, the unemployment rate came in at 9.6 percent, compared to 9.5 percent in July. For the latest month, household employment rebounded 290,000 as the labor force jumped 550,000. The number of unemployed rose 261,000. Basically, more discouraged workers have decided that conditions have improved enough to actually spend time looking for work. The BLS does not count an unemployed worker as part of the labor force unless the worker is actively seeking employment.
Overall, the August employment report shows that the economy is not going back to recession. Still, growth is less than robust. For now, it appears to be a growth recession (less than long-term trend), but not an outright recession. But growth is still better than decline.
 The economy really cannot grow much if the consumer is not helping. The consumer makes up over two-thirds of the U.S. economy. In July, the consumer got more spending power and actually used it. Notably, underlying detail in the personal income report was stronger than the headline. The economy really cannot grow much if the consumer is not helping. The consumer makes up over two-thirds of the U.S. economy. In July, the consumer got more spending power and actually used it. Notably, underlying detail in the personal income report was stronger than the headline.
Personal income in July posted a 0.2 percent gain, following no change in June. More importantly, the wages & salaries component rebounded 0.3 percent after slipping 0.1 percent in June. This component would have been even stronger had it not been for a dip in government payrolls from the laying off temporary Census workers. Private industry wages and salaries gained 0.5 percent in July, following a 0.1 percent dip in June.
 Indeed, the consumer is opening his and her wallet a little wider. Overall personal consumption increased 0.4 percent in July, following a flat number in June. By components, durables jumped 0.9 percent, nondurables rose 0.3 percent, and services gained 0.4 percent Indeed, the consumer is opening his and her wallet a little wider. Overall personal consumption increased 0.4 percent in July, following a flat number in June. By components, durables jumped 0.9 percent, nondurables rose 0.3 percent, and services gained 0.4 percent
While some have worried about deflation (prices falling due to plunging demand), inflation is back in positive territory but subdued. Headline PCE inflation came in at plus 0.2 percent in July, following two months of down 0.1 percent. The core rate edged up 0.1 percent after a flat reading in June. The Fed for now can focus on boosting economic growth and not worry about near-term inflation. Rates are still at the lower bound of the Fed’s implicit target range of 1-1/2 to 2 percent. Year-ago headline PCE inflation firmed to 1.5 percent from 1.4 percent in June. Year-ago core PCE inflation is unchanged at 1.4 percent.
 Quite a few financial web pages screamed headlines that August auto sales were the worst for August in 28 years or something like that. Well, what really matters is the latest number compared to the previous number. That is, what is the change in direction on the margin' What is the latest information content for the economy' Quite a few financial web pages screamed headlines that August auto sales were the worst for August in 28 years or something like that. Well, what really matters is the latest number compared to the previous number. That is, what is the change in direction on the margin' What is the latest information content for the economy'
Total sales of domestics and imports of autos and light trucks for August came in at an annualized 11.5 million units, matching the July pace. OK, if you want to be picky, it was 11.47 million in August, down 0.6 percent from 11.54 million in August. On the margin, sales are holding up. But without a doubt, the latest is sharply lower than the cash-for-clunkers jacked number of 14.2 million in August 2009.
There was a big difference in August for domestics and imports. Total domestic sales slipped 3.8 percent to an annualized 8.3 million from 8.7 million in July. Imports gained 8.8 percent to 3.1 million from 2.9 million in July. Import cars were the big source of strength, jumping a monthly 11.1 percent.
One concern, however, is who is buying. Industry sources indicate that sales have been supported by fleet purchases by rental companies and others. For the latest data, it is an issue of the Bureau of Economic Analysis (in Commerce) splitting the sales between consumer purchases and equipment investment in the GDP calculation for the third quarter (using auto registration data). Beyond that, are consumers still in the market' The latest data suggest they are not all in but they aren’t all out either. The underlying trend is that sales dropped during the recession, but cars continued to wear out. There probably is still mild pent up demand coming into play as seen in the steady rise in sales since early 2009.
 Consumer confidence has basically been range bound since late 2009. Confidence is up from recession lows but not much progress has been made since late 2009. The Conference Board's consumer confidence index rebounded to 53.5 in August from 51.0 in July. But it is still down almost 10 points from May. The jobs picture is what concerns consumers the most. Consumer confidence has basically been range bound since late 2009. Confidence is up from recession lows but not much progress has been made since late 2009. The Conference Board's consumer confidence index rebounded to 53.5 in August from 51.0 in July. But it is still down almost 10 points from May. The jobs picture is what concerns consumers the most.
Consumers were slightly less pessimistic about future employment prospects. Those expecting more jobs in the months ahead increased to 14.6 percent from 14.2 percent, while those anticipating fewer jobs decreased to 19.4 percent from 20.9 percent. Nonetheless, those saying jobs are hard to get came in at 45.7 percent compared to July's 45.1 percent for the worst reading since February. The proportion of consumers expecting an increase in their incomes held steady at 10.6 percent.
 Due to the slowdown in output and businesses already having cut labor costs to the bone, productivity fell notably in the second quarter. Nonfarm business productivity declined an annualized 1.8 percent in the second quarter after a 3.9 percent advance in the prior quarter. Unit labor costs rebounded an annualized 1.1 percent in the second quarter, following a drop of 4.6 percent in the first quarter. Due to the slowdown in output and businesses already having cut labor costs to the bone, productivity fell notably in the second quarter. Nonfarm business productivity declined an annualized 1.8 percent in the second quarter after a 3.9 percent advance in the prior quarter. Unit labor costs rebounded an annualized 1.1 percent in the second quarter, following a drop of 4.6 percent in the first quarter.
The drop in productivity reflected in part a slower 1.6 gain in nonfarm business output after a 5.0 percent jump in the first quarter. Also, hours worked jumped to a 3.5 percent pace from 1.1 percent in the first quarter.
While the latest productivity report is not as favorable for profits as the recent string of gains, the good news is that companies may have pressure to start hiring. Any notable and apparently sustainable boost in company demand should result in additions to payrolls.
 Figuring out the status of the manufacturing sector has been tricky lately. Payroll employment showed a drop in manufacturing employment in August, but it may have just been atypical seasonal retooling in autos. And now the ISM manufacturing index strengthens as its new orders sub-index slows. Figuring out the status of the manufacturing sector has been tricky lately. Payroll employment showed a drop in manufacturing employment in August, but it may have just been atypical seasonal retooling in autos. And now the ISM manufacturing index strengthens as its new orders sub-index slows.
The ISM manufacturing composite index came in at a stronger-than-expected 56.3 for a sizable eight tenths gain from July. The reading is well over 50 to signal month-to-month growth and in the comparison with July, to signal growth at an accelerating rate.
But a likely indicator for near-term growth, the new orders index slowed a bit, down four tenths to 53.1 for its lowest reading since the manufacturing recovery began early last year. But a counter argument showed up in the employment index which rose to a healthy 60.4 from 58.6 in July. The argument is that manufacturers would not be hiring if they were not expecting more business. The bottom line is that manufacturing is likely still on an uptrend—the question remaining on the degree of strength.
 Another sign that economic growth is slowing came from the ISM non-manufacturing report—out later in the day on Friday after the employment situation. The ISM non-manufacturing composite index fell 3 points to 51.5—just a little above the breakeven level of 50. Numbers above 50 reflect positive growth. New orders also slowed, easing more than 4 points to 52.4, suggesting modest growth ahead for the non-manufacturing sector. Also, backlog orders are basically flat. Another sign that economic growth is slowing came from the ISM non-manufacturing report—out later in the day on Friday after the employment situation. The ISM non-manufacturing composite index fell 3 points to 51.5—just a little above the breakeven level of 50. Numbers above 50 reflect positive growth. New orders also slowed, easing more than 4 points to 52.4, suggesting modest growth ahead for the non-manufacturing sector. Also, backlog orders are basically flat.
The bottom line is that the non-manufacturing sector is showing very modest growth but is staying out of negative territory.
The housing market is not dead, according to the latest pending home sales report from the National Association of Realtors.  The Pending Home Sales Index rose 5.2 percent in July to end two months of post-stimulus declines—down 2.8 percent in June and plunging 29.9 percent in May. Although coming off a very weak June level, what makes the July figure encouraging is that this series is based on contract signings and not closings. You can’t say this bump in sales was due to the extension of the special incentives tax credit program to September. The extension is for closings and only for contracts signed by the end of April. So, the July pending home sales reflect fresh activity—albeit at a low level. Nonetheless, it suggests that housing may not be headed for another downturn—just a stagnant, low level. The Pending Home Sales Index rose 5.2 percent in July to end two months of post-stimulus declines—down 2.8 percent in June and plunging 29.9 percent in May. Although coming off a very weak June level, what makes the July figure encouraging is that this series is based on contract signings and not closings. You can’t say this bump in sales was due to the extension of the special incentives tax credit program to September. The extension is for closings and only for contracts signed by the end of April. So, the July pending home sales reflect fresh activity—albeit at a low level. Nonetheless, it suggests that housing may not be headed for another downturn—just a stagnant, low level.
 Home prices are still on an uptrend—but it is very uncertain that will continue in the near term. The Case-Shiller composite-10 index rose 1.0 percent in June, following a 1.3 percent gain in May on a not seasonally adjusted basis. But summer is the peak buying season which puts upward pressure on prices. Seasonally adjusted data show a smaller 0.3 percent rise, slower than the 0.5 percent gains in May and April. The year-on-year rate in June also eased, to plus 5.0 percent for both the unadjusted and adjusted index, compared to a plus 5.4 percent unadjusted rise in May and a rise of 5.5 percent when adjusted. The outlook for home prices is worrisome, given the general backdrop of ballooning supply, foreclosures, and distressed sales. Home prices are still on an uptrend—but it is very uncertain that will continue in the near term. The Case-Shiller composite-10 index rose 1.0 percent in June, following a 1.3 percent gain in May on a not seasonally adjusted basis. But summer is the peak buying season which puts upward pressure on prices. Seasonally adjusted data show a smaller 0.3 percent rise, slower than the 0.5 percent gains in May and April. The year-on-year rate in June also eased, to plus 5.0 percent for both the unadjusted and adjusted index, compared to a plus 5.4 percent unadjusted rise in May and a rise of 5.5 percent when adjusted. The outlook for home prices is worrisome, given the general backdrop of ballooning supply, foreclosures, and distressed sales.
Also, the June Case-Shiller was supported by the final rush by homebuyers to qualify for the special tax credits which required a contract signing by April and close by September. The Case-Shiller indexes are a three-month moving average as published in the news released. So, the June number basically is the mid-point of April, May, and June closing activity—which was heavily influenced by rush sales.
Basically, the economy has slowed but remains positive. But growth currently appears for now to be less than needed to generate job growth at a pace that meets or beats growth in the labor force. In plain English, the economy is growing but not fast enough to keep unemployment from rising. Nonetheless, the consumer sector is holding up although remaining skittish. And housing may be managing to stay flat instead of heading back down.
The highlights of the holiday shortened week will be Thursday’s international trade and jobless claims reports. We will see if exports continue to rise and if fewer workers are laid off. Also, the Fed’s Beige Book is out on Wednesday and will provide the setting for the latest round of debate on monetary policy.
U.S. Holiday: Labor Day. All Markets Closed
The Beige Book being prepared for the September 21 meeting will be released. Given that this will be the first notable U.S. economic news in a holiday shortened week with thin trading, markets could react significantly—especially if there is especially positive or negative commentary on sensitive areas such as consumer spending, housing, or hiring.
Consumer credit outstanding in June contracted $1.3 billion—but at least it was at a slower pace than in recent months. Credit in May fell $5.3 billion while April dropped a particularly severe $14.9 billion. Simply, the consumer sector is showing weak demand for loans combined with tight bank lending and heavy charge offs by banks.
Consumer credit Consensus Forecast for July 10: -$3.5 billion
Range: -$6.0 billion to +$0.0 billion
Initial jobless claims for the August 28 week declined 6,000 to 472,000 from a revised 478,000 in the prior week. The numbers are still high but still notably below the 2010 peak of 504,000 the week before that. Continuing claims fell 23,000 to 4.456 million in data for the August 21 week. The decline in continuing claims reflects both hiring and unfortunately also the expiration of benefits.
Jobless Claims Consensus Forecast for 9/4/10: 470,000
Range: 465,000 to 480,000
The U.S. international trade gap in June spiked to $49.9 billion from $42.0 billion in May. Exports fell 1.3 percent, following a 2.5 percent gain in May. Overall imports advanced 3.0 percent in June after rising 2.8 percent the month before. The widening of the trade gap was primarily in non-oil. The nonpetroleum deficit widened to $40.0 billion in June from $32.2 billion the prior month. The petroleum goods gap, however, narrowed to $21.2 billion from $21.5 billion in May.
International trade balance Consensus Forecast for July 10: -$46.8 billion
Range: -$53.4 billion to -$43.0 billion
R. Mark Rogers is the author of The Complete Idiot’s Guide to Economic Indicators, Penguin Books, October 2009.
Econoday Senior Writer Mark Pender contributed to this article.
|
