|
As expected, February’s severe snow storms dumped on housing data. Meanwhile, manufacturing continues a moderate uptrend based on Fed numbers and regional surveys. Importantly, low inflation at both the producer and consumer levels is letting the Fed remain loose on monetary policy.
 Dipping moderately at close of the week, the Dow ended an eight-day winning streak. Blue chips were up notably for the week with small caps down and techs up slightly. While economic news was mixed for the week, indicators either met or beat expectations with only a minor exception (leading indicators). Markets did not really start moving until Tuesday as the drop in February housing starts was less than expected and the Fed kept its language for rates staying low for an “extended period” in its FOMC announcement. Dipping moderately at close of the week, the Dow ended an eight-day winning streak. Blue chips were up notably for the week with small caps down and techs up slightly. While economic news was mixed for the week, indicators either met or beat expectations with only a minor exception (leading indicators). Markets did not really start moving until Tuesday as the drop in February housing starts was less than expected and the Fed kept its language for rates staying low for an “extended period” in its FOMC announcement.
Equities got a boost on Wednesday from a sizeable drop in the headline producer price index which added to the view that the Fed can maintain low rates for some time. Thursday’s CPI report was tame but markets had already baked that in from the PPI the day before. Although the Dow was up, most stocks dipped Thursday on speculation that the Fed would be raising the discount rate any day. Also, more worries about how to finance Greek debt unsettled markets. At week end, stocks dropped on news that India had raised a key policy rate and on worse-than-expected profits from Palm which battered the techs and telecoms.
Equities were mostly up this past week. The Dow was up 1.1 percent; the S&P 500, up 0.9 percent; the Nasdaq, up 0.3 percent; and the Russell 2000, down 0.4 percent.
For the year-to-date, major indexes are up as follows: the Dow, up 3.0 percent; the S&P 500, up 4.0 percent; the Nasdaq, up 4.6 percent; and the Russell 2000, up 7.8 percent.
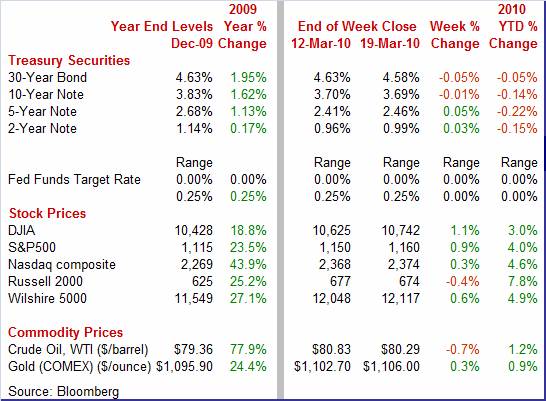
Weekly percent change column reflects percent changes for all components except interest rates. Interest rate changes are reflected in simple differences.
 Treasury yields were mixed this past week with shorter yields up but down slightly for longer maturities. Rates were relatively stable during the week, showing only modest swings daily. Most rates fell moderately on Tuesday as the Fed’s FOMC statement indicated that the fed funds rate would remain low for an “extended period.” On Wednesday, a lower-than-expected PPI signaled low inflation pressures, nudging rates down. Although CPI numbers were extremely tame on Thursday, a better-than-expected Philly Fed manufacturing index bumped rates up for the day. Rates firmed at week end just ahead of close as trading thinned and traders were nervous ahead of the Fed’s March 31 end date for finishing its $1.25 trillion in purchases of mortgage-backed securities. Treasury yields were mixed this past week with shorter yields up but down slightly for longer maturities. Rates were relatively stable during the week, showing only modest swings daily. Most rates fell moderately on Tuesday as the Fed’s FOMC statement indicated that the fed funds rate would remain low for an “extended period.” On Wednesday, a lower-than-expected PPI signaled low inflation pressures, nudging rates down. Although CPI numbers were extremely tame on Thursday, a better-than-expected Philly Fed manufacturing index bumped rates up for the day. Rates firmed at week end just ahead of close as trading thinned and traders were nervous ahead of the Fed’s March 31 end date for finishing its $1.25 trillion in purchases of mortgage-backed securities.
For this past week Treasury rates were mixed as follows: 3-month T-bill, up 1 basis point; the 2-year note, up 3 basis points; the 5-year note, up 5 basis points; the 7-year note, up 1 basis point; the 10-year bond, down 1 basis point; and the 30-year bond, down 5 basis points.
 For broader perspective, short rates have been held hostage to extremely loose Fed policy since late 2008 as fed funds have been almost zero. Longer maturity yields have bounced back notably from the extreme flight to safety during late 2008 as equities went into freefall. In addition to reversal of flight to quality, longer rates have been bumped up due to supply concerns from the high federal deficit and projected deficits. But in very recent days, the gap between the 2-year and 10-year Treasury notes has narrowed as inflation expectations have eased. For broader perspective, short rates have been held hostage to extremely loose Fed policy since late 2008 as fed funds have been almost zero. Longer maturity yields have bounced back notably from the extreme flight to safety during late 2008 as equities went into freefall. In addition to reversal of flight to quality, longer rates have been bumped up due to supply concerns from the high federal deficit and projected deficits. But in very recent days, the gap between the 2-year and 10-year Treasury notes has narrowed as inflation expectations have eased.
 Oil prices were quite volatile this past week but ended down net and little changed. Oil prices were quite volatile this past week but ended down net and little changed.
The spot price of West Texas Intermediate dropped sharply at week open over concern about sovereign debt for countries such as Greece and Spain. A stronger dollar also weighed on oil. But oil reversed course on Tuesday as the Fed kept rates low and the dollar fell. Prices firmed further on Wednesday on a drop in oil inventories. Crude fell sharply on the final day of the week over renewed concerns that Greece would not be able to obtain financial assistance from the European Union and as the dollar gained.
Net for the week, spot prices for West Texas Intermediate edged down 54 cents per barrel to settle at $80.29.
The first quarter continues to be mixed. Housing has been damped by atypically severe weather and from coming off tax incentives. Manufacturing is still the bright spot, showing continued but volatile gains. Meanwhile, inflation numbers have come in very soft—although that may not be long lived given recent gains in oil prices.
 Housing starts have been volatile lately and this time the culprit was atypically severe winter weather. Snow storms bumped down housing starts in February, leading to a 5.9 percent drop, following a 6.6 percent rebound the month before. February's annualized pace of 0.575 million was up 0.2 percent on a year-ago basis. The decline in February was led by a 30.3 percent decrease in multifamily starts, following a 18.5 percent gain in January. The single-family component slipped 0.6 percent after a 4.4 percent rise the prior month. Housing starts have been volatile lately and this time the culprit was atypically severe winter weather. Snow storms bumped down housing starts in February, leading to a 5.9 percent drop, following a 6.6 percent rebound the month before. February's annualized pace of 0.575 million was up 0.2 percent on a year-ago basis. The decline in February was led by a 30.3 percent decrease in multifamily starts, following a 18.5 percent gain in January. The single-family component slipped 0.6 percent after a 4.4 percent rise the prior month.
Highlighting the impact of the snow storms are starts by region. The February drop in starts was led by a 15.5 percent plunge in the South which typically has relatively good weather for groundbreaking that time of year. Also, starts in the Northeast fell 9.6 percent. Both regions were hit by heavy snow storms during the month. Starts in the Midwest rose 10.6 percent while the West gained 7.9 percent.
Starts are under downward pressure in coming months as housing permits declined 1.6 percent, following a 4.7 percent fall in January. The only good news from the latest starts report is the implication that we may get a weather-related rebound in March.
 Volatile seems to be a very common adjective lately for economic indicators and it clearly applies to recent industrial production numbers. For several months, a strong gain has been followed by a soft month—meaning that on average, output growth has been OK. We saw this patter over the last two months as overall industrial production in February posted a small 0.1 percent rise after a 0.9 percent jump in January. Although overall industrial production managed to pull off a modest increase for February, it was mainly weather related from higher utilities output. The manufacturing component, however, dipped. Volatile seems to be a very common adjective lately for economic indicators and it clearly applies to recent industrial production numbers. For several months, a strong gain has been followed by a soft month—meaning that on average, output growth has been OK. We saw this patter over the last two months as overall industrial production in February posted a small 0.1 percent rise after a 0.9 percent jump in January. Although overall industrial production managed to pull off a modest increase for February, it was mainly weather related from higher utilities output. The manufacturing component, however, dipped.
The manufacturing component, however, fell back 0.2 percent, following a 0.9 percent spike in January. Weakness was led by motor vehicles—other components were mixed. For the latest month, utilities output jumped 0.5 percent after rising 0.6 percent the month before. Mining output increased 2.0 percent after advancing 1.1 percent in January.
 Indeed, the motor vehicles & parts component pulled down manufacturing as it fell 4.4 percent after jumping 4.7 percent in January. Excluding motor vehicles, manufacturing nudged up 0.1 percent, following a 0.7 percent boost in January. Again, the key point is that the numbers on average continue a moderately strong upward trend. Indeed, the motor vehicles & parts component pulled down manufacturing as it fell 4.4 percent after jumping 4.7 percent in January. Excluding motor vehicles, manufacturing nudged up 0.1 percent, following a 0.7 percent boost in January. Again, the key point is that the numbers on average continue a moderately strong upward trend.
Capacity utilization remains low as it edged up to 72.7 percent in February from 72.5 percent the month before.
But for manufacturing overall, early warnings are still quite positive as indicated by recent regional manufacturing surveys.
 Manufacturing is doing well in the mid-Atlantic and New York State regions, according to recent Fed District Bank surveys. First, the Philly Fed’s general business activity index for March strengthened further to a reading of 18.9 from February's 17.6. Manufacturing is doing well in the mid-Atlantic and New York State regions, according to recent Fed District Bank surveys. First, the Philly Fed’s general business activity index for March strengthened further to a reading of 18.9 from February's 17.6.
New orders were not as strong but still well into positive territory. New orders came in at 9.3 to indicate month-to-month growth but moderated from a strong 22.7 reading for February. Still, on average the new orders index looks good.
 A big plus in the report was a big gain in the six-month outlook, at 52.0, compared to 35.8 in February. The outlook for new orders also improved, up nearly 4 points to 45.2. The latter is crucial as it likely will lead to new hires and eventually capacity expansion.
The New York Fed’s Empire State manufacturing survey also was quite healthy for March. New orders, shipments, inventories, delivery times and employment all posted month-to-month increases. The Empire State's general business conditions index did slow by more than 2 points to 22.86 in March, but the reading is still far over zero, indicating significant month-to-month expansion. There also is significant forward momentum as the new orders index spiked to 25.43 in March from 8.78 in February. The bottom line is that despite monthly volatility, early indications are that manufacturing is doing well in March.
 The Fed got at least a temporary reprieve on inflation numbers in February as energy costs fell back for both the PPI and CPI. The overall PPI dropped 0.6 percent after spiking 1.4 percent in January. At the core level, the PPI inflation rate eased to a 0.1 percent rise from a 0.3 percent gain in January. The latest core number matched expectations. The Fed got at least a temporary reprieve on inflation numbers in February as energy costs fell back for both the PPI and CPI. The overall PPI dropped 0.6 percent after spiking 1.4 percent in January. At the core level, the PPI inflation rate eased to a 0.1 percent rise from a 0.3 percent gain in January. The latest core number matched expectations.
 The drop in the headline PPI was led by a 2.9 percent decrease in energy costs after 5.1 percent surge in January. Gasoline fell 7.4 percent, following an 11.5 percent spike in January. The February drop in gasoline prices was the largest since an 11.5 percent plunge in July of last year. Food cost inflation held steady at 0.4 percent. Within the core, tobacco prices dipped 0.1 percent as did light trucks. The drop in the headline PPI was led by a 2.9 percent decrease in energy costs after 5.1 percent surge in January. Gasoline fell 7.4 percent, following an 11.5 percent spike in January. The February drop in gasoline prices was the largest since an 11.5 percent plunge in July of last year. Food cost inflation held steady at 0.4 percent. Within the core, tobacco prices dipped 0.1 percent as did light trucks.
There is quite a divergence in year-ago numbers for headline versus core as a result of recently higher energy and food prices. For the overall PPI, the year-on-year rate declined to 4.6 percent from 5.0 percent in January (seasonally adjusted). This is still sharply higher than the core year-ago rate which slipped to 0.9 percent from 1.0 percent the month before. On a not seasonally adjusted basis for February, the year-ago increase for the headline PPI was up 4.4 percent while the core was up 1.0 percent.
 While energy costs have been trending upward over the past year, they temporarily weakened in February, halting consumer price inflation for the month. Overall CPI inflation for February eased to no change from 0.2 percent the month before. Core CPI inflation rebounded a modest 0.1 percent, following a 0.1 percent dip in January. A number of weak components point to the fact that inflation pressures, indeed, are subdued. Shelter costs were flat in the latest month while declines also were seen in apparel and recreation. While energy costs have been trending upward over the past year, they temporarily weakened in February, halting consumer price inflation for the month. Overall CPI inflation for February eased to no change from 0.2 percent the month before. Core CPI inflation rebounded a modest 0.1 percent, following a 0.1 percent dip in January. A number of weak components point to the fact that inflation pressures, indeed, are subdued. Shelter costs were flat in the latest month while declines also were seen in apparel and recreation.
Looking at detail, the energy component of the CPI declined 0.5 percent in February after jumping 2.8 percent the month before. Gasoline temporarily eased 1.4 percent, following a 4.4 percent jump in January. Food inflation slowed in February to 0.1 percent from 0.2 percent in January. Other components were mixed.
 Year-on-year, overall CPI inflation fell to 2.2 percent (seasonally adjusted) from 2.7 percent in January. The core rate was slipped in February to 1.3 percent from 1.5 percent the month before. Year-on-year, overall CPI inflation fell to 2.2 percent (seasonally adjusted) from 2.7 percent in January. The core rate was slipped in February to 1.3 percent from 1.5 percent the month before.
A big reason that the core rate has eased so much is because of weakness in shelter costs. Shelter costs make up 32.3 percent of the overall CPI and 41.6 percent of the core CPI. Subcomponents of shelter include rent of primary residence, lodging away from home, owners’ equivalent rent, and shelter related insurance. The two largest subcomponents are rent and owners’ equivalent rent. Their shares of the headline CPI are 6.0 percent and 23.6 percent respectively, and for the core CPI, 7.7 percent and 32.4 percent, respectively.
On a year-ago basis, owners’ equivalent rent has come down from a cyclical peak of 4.3 percent seen as recently as February 2007 to the current 0.3 percent. Rent has fallen from a cyclical peak of 4.6 percent in March 2007 to a current 0.3 percent. These two series have been pulled down by the still weak housing sector as high unemployment has left more apartments vacant and reduced rental and housing demand.
The really negative subcomponent was lodging while away from home which was down 5.1 percent in February, but not quite as weak as down 8.9 percent in July of last year. This subcomponent, however, is relatively small—0.8 percent of the headline CPI and 1.0 percent of the core. Both business trips and leisure travel have fallen, leading to more discounting by hotels and resorts.
The bottom line is that even as higher oil prices are likely to bump up the headline CPI in coming months, a weak shelter component will help keep the core rate soft—and to the Fed’s liking.
 Based on the latest leading indicators report, the recovery is slowing down. But we likely will see modest improvement in this index in coming months. For February, the index of leading economic indicators inched up 0.1 percent, following a 0.3 percent gain the month before. These two numbers are less robust than the sharp increases seen the prior seven months. Based on the latest leading indicators report, the recovery is slowing down. But we likely will see modest improvement in this index in coming months. For February, the index of leading economic indicators inched up 0.1 percent, following a 0.3 percent gain the month before. These two numbers are less robust than the sharp increases seen the prior seven months.
As has been the case for some time, the yield spread between the overnight funds rate and the 10-year yield was by far the report's most positive element, a reflection of the Fed's zero-rate policy. The second biggest plus in February was money supply, which is somewhat volatile on a monthly basis. Vendor deliveries were a positive, reflecting a slowing in delivery times—but it likely was weather related (snow storms) and not due to bottlenecks from stronger business.
The biggest negative was a decline in the factory workweek. But with manufacturing relatively strong, that is likely to reverse. Stock prices were the second biggest negative and this, too, is likely to swing the other way in March if the current stock market rally continues. But two negatives may not be showing much improvement soon. Consumer expectations have been stubbornly weak due to continued high unemployment and now high gasoline prices should weigh on consumer spirits. Building permits have weakened recently due to the fall off in home sales after the surge from the initial round of tax credits for first-time homebuyers.
Initial jobless claims were a slightly negative factor for February but essentially neutral. With company layoffs slowing, this factor on average will likely be marginally positive in coming months. However, fewer initial claims is not the same as more actual jobs.
 There were no surprises in the latest FOMC statement on March 16. The Fed voted to keep the fed funds target rate at a range of zero to 0.25 percent. Importantly, the statement kept the language that interest rates are likely to remain low "for an extended period." The discount rate was unchanged at 0.75 percent. There were no surprises in the latest FOMC statement on March 16. The Fed voted to keep the fed funds target rate at a range of zero to 0.25 percent. Importantly, the statement kept the language that interest rates are likely to remain low "for an extended period." The discount rate was unchanged at 0.75 percent.
The commentary on the economy is unchanged, noting that the economy is continuing to strengthen but sectors are mixed.
A notable change was in regard to the labor market which is now described as "stabilizing" rather than the previous "deterioration" is "abating." Also, the divergence in business spending was highlighted with equipment and software having "risen significantly" while structures investment "is still contracting."
And comments on inflation potential are unchanged with near-term expectations of subdued inflation.
"With substantial resource slack continuing to restrain cost pressures and with longer-term inflation expectations stable, inflation is likely to be subdued for some time."
Other changes in the statement are an update on the winding down of emergency lending facilities and additional explanation on the dissent.
The statement noted that the Term Asset-Backed Securities Loan Facility is scheduled to close on June 30 for loans backed by new-issue commercial mortgage-backed securities and on March 31 for loans backed by all other types of collateral.
Again there was dissent as the vote for the statement was 9 to 1 with Kansas City Fed President Thomas Hoenig voting against. As before, he opposed the "extended period" language.
Although there were no changes in the target rate and the discount rate, the Fed is shifting policy. It recently started the process of normalizing the spread between the fed funds target rate and the discount rate. By month end, the Fed will no longer be buying mortgage-backed securities and this is actually a firming in policy. In the near term, the Fed likely will not be raising the fed funds target rate but it soon will start draining excess reserves sometime very soon. As the economy strengthens the Fed will need to drain some $1 trillion in excess reserves over a short time frame. But these coming events should not be a surprise-the Fed has been telegraphing these pending actions for some time.
There were mixed signals on the economy as atypically adverse weather weighed on housing. And industrial production has seen large swings in growth recently. But manufacturing has moderately healthy forward momentum and housing will likely recover from snow storm depressed levels. Inflation currently is not a worry for the Fed, so loose monetary policy will continue to support a moderate recovery.
The only traditional market moving indicator out this week is GDP as the Commerce Department wraps up its calculations on the fourth quarter at week end. But housing will be the talk of the week with existing home sales and new home sales out on Tuesday and Wednesday, respectively.
Existing home sales have plunged since the tax credit induced surge in the autumn. Existing home sales fell 7.2 percent in January after falling 16.2 percent in December. January's annual rate of 5.05 million was much lower than rates of 5.44 million units in December and the stimulus-boosted 6.49 million for November. Supply jumped back up, rising to 7.8 months from December's 7.2 months and November's 6.5 months. Realtors are hopeful that there will be a second round of boosts to sales as the extended tax credits for homebuyers expire in April. But heavy snow storms in February likely kept sales down for the month.
Existing home sales Consensus Forecast for February 10: 5.00 million-unit rate
Range: 4.80 to 5.20 million-unit rate
Durable goods orders in January posted a healthy revised 2.6 percent gain, following a 1.8 percent rebound in December. But excluding transportation, new durables orders fell 1.0 percent after a 1.9 percent gain in December. The decline in the core was led by a sharp drop in new orders for machinery. Otherwise, gains in the core were widespread. Recent regional manufacturing surveys and ISM point toward another healthy rise for durables orders in February.
New orders for durable goods Consensus Forecast for February 10: +1.0 percent
Range: -1.5 percent to +2.0 percent
New home sales dropped a sharp 11.2 percent in January after dipping 3.9 percent the month before. The January annualized pace of 309,000 was down 6.1 percent on a year-ago basis. For the latest month, months’ supply jumped to 9.1 months from 8.0 months in December. Look for February numbers to be kept low by severe snow storms in many parts of the U.S.
New home sales Consensus Forecast for February 10: 315 thousand-unit annual rate
Range: 290 thousand to 330 thousand-unit annual rate
Initial jobless claims have shown only incremental improvement in recent weeks, falling only 5,000 in the March 13 week to 457,000 and after a 6,000 dip in the prior week. The four-week average fell 4,250 to 471,250, showing no significant change from February and remaining well above readings in January.
Jobless Claims Consensus Forecast for 3/20/10: 450,000
Range: 445,000 to 460,000
GDP growth for the fourth quarter’s second estimate was revised upward to an annualized 5.9 percent from the initial estimate of 5.7 percent. The higher estimate reflected more positive contributions from private inventory investment, exports, personal consumption expenditures (PCE), and nonresidential fixed investment. Imports, which are a subtraction in the calculation of GDP, increased. Unfortunately, final sales growth was revised to a more modest 1.9 percent increase from the original estimate of 2.2 percent. Analysts are hoping that the second revision to GDP has a higher number for final sales. On the inflation front, the GDP price index was revised down to a 0.4 percent rise, compared to the original estimate of an annualized 0.6 percent.
Real GDP Consensus Forecast for second estimate Q4 09: +5.9 percent annual rate
Range: +5.7 to +6.0 percent annual rate
GDP price index Consensus Forecast for second estimate Q4 09: +0.4 percent annual rate
Range: +0.4 to +0.6 percent annual rate
The Reuter's/University of Michigan's Consumer sentiment index slipped back in the mid-March reading to 72.5 from February's 73.6. Both current conditions and expectations dipped with expectations showing particular weakness. Apparently, consumers without jobs have become gloomier about prospects in the near term. Initial jobless claims are stuck at a relatively high level and the median number of weeks of unemployment is also quite high, adding to the pessimism of the jobless. Higher gasoline prices are not helping either.
Consumer sentiment Consensus Forecast for final March 10: 73.0
Range: 72.5 to 75.0
R. Mark Rogers is the author of The Complete Idiot’s Guide to Economic Indicators, Penguin Books, October 2009.
Econoday Senior Writer Mark Pender contributed to this article.
|
