|
The recovery is moving forward despite the lack of job growth. Importantly, consumer spending is picking up even though consumer sentiment is very weak. Apparently, the difference in spending and sentiment is whether you have a job or not. And those with jobs appear to be less nervous based on recent retail sales numbers. Meanwhile, the jobless remain quite discouraged.
 Equities netted moderate gains this past week but largely on light volume. A variety of factors boosted stocks as the week was light with economic indicators. Stocks got some lift Tuesday with Boeing shares advancing after Northrop Grumman withdrew as a bidder for a U.S. Air Force air-tanker contract. Wednesday, favorable comments from analysts boosted bank stocks. Also, the Commerce Department said wholesale inventories slipped in January, implying that consumer demand is strengthening. On Thursday, stocks showed significant gains despite initial jobless claims remaining elevated as Citigroup CEO Vikram Pandit stated he expected the bank to post significant profits in coming quarters. Also, a parliamentary move in the Senate made it harder to enact health care reform, boosting health care stocks. Equities ended the week mixed despite strong retail sales numbers for February from the Commerce Department. Offsetting news was a dip in consumer sentiment for March. Equities netted moderate gains this past week but largely on light volume. A variety of factors boosted stocks as the week was light with economic indicators. Stocks got some lift Tuesday with Boeing shares advancing after Northrop Grumman withdrew as a bidder for a U.S. Air Force air-tanker contract. Wednesday, favorable comments from analysts boosted bank stocks. Also, the Commerce Department said wholesale inventories slipped in January, implying that consumer demand is strengthening. On Thursday, stocks showed significant gains despite initial jobless claims remaining elevated as Citigroup CEO Vikram Pandit stated he expected the bank to post significant profits in coming quarters. Also, a parliamentary move in the Senate made it harder to enact health care reform, boosting health care stocks. Equities ended the week mixed despite strong retail sales numbers for February from the Commerce Department. Offsetting news was a dip in consumer sentiment for March.
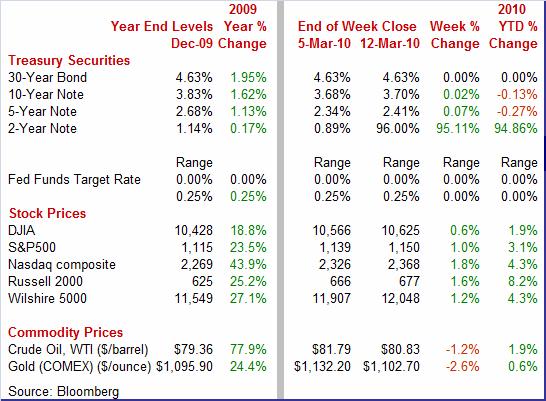
Equities were up this past week. The Dow was up 0.6 percent; the S&P 500, up 1.0 percent; the Nasdaq, up 1.8 percent; and the Russell 2000, up 1.6 percent.
For the year-to-date, major indexes are up as follows: the Dow, up 1.9 percent; the S&P 500, up 3.1 percent; the Nasdaq, up 4.3 percent; and the Russell 2000, up 8.2 percent.
This past week was a milestone for many indexes as the latest bear market hit bottom for the Dow and other indexes a year ago on March 9, 2009. The following table shows how key indexes have fared since that bottom as well as since historical peaks.
Weekly percent change column reflects percent changes for all components except interest rates. Interest rate changes are reflected in simple differences.
 Treasury yields were mostly up slightly for the week net. Rates drifted during the week with little conviction. Yields firmed modestly on Monday as traders positioned ahead of auctions for the week. Rates eased marginally on Tuesday on comments by Chicago Federal Reserve Bank President Charles Evans that he expects the Fed to keep rates low for an extended period. Rates bumped up on Wednesday as funds flooded into stocks. Strong equity gains on Thursday also lifted Treasury yields. But on Friday rates eased slightly on a fall back in consumer sentiment. Treasury yields were mostly up slightly for the week net. Rates drifted during the week with little conviction. Yields firmed modestly on Monday as traders positioned ahead of auctions for the week. Rates eased marginally on Tuesday on comments by Chicago Federal Reserve Bank President Charles Evans that he expects the Fed to keep rates low for an extended period. Rates bumped up on Wednesday as funds flooded into stocks. Strong equity gains on Thursday also lifted Treasury yields. But on Friday rates eased slightly on a fall back in consumer sentiment.
For this past week Treasury rates were mostly up as follows: the 2-year note, up 7 basis points; the 5-year note, up 7 basis points; the 7-year note, up 4 basis points; and the 10-year bond, up 2 basis points. The 3-month T-bill, however, slipped 1 basis point while the 30-year bond was unchanged.
 Oil prices edged down net for the week but remained quite elevated. The spot price for West Texas Intermediate traded in a narrow range the first four days of the week but fell $1.28 per barrel the last trading day on news that consumer sentiment had fallen. Oil prices edged down net for the week but remained quite elevated. The spot price for West Texas Intermediate traded in a narrow range the first four days of the week but fell $1.28 per barrel the last trading day on news that consumer sentiment had fallen.
Net for the week, spot prices for West Texas Intermediate dropped 96 cents per barrel to settle at $80.83. Spot WTI has been above $80 per barrel all month except for March 1. Thursday’s level of $82.11 was the highest settle since January 11’s $82.52.
Estimates for first quarter GDP were probably bumped up a bit this past week after better-than-expected numbers for retail sales and the international trade deficit.
 Analysts had expected February’s snow storms to chill consumer spending for the month. Apparently, consumers more than caught up on spending when the snow melted as February sales were much stronger than expected. Overall retail sales in February rose 0.3 percent after rebounding 0.1 percent in January. But the gain was far better after discounting a drop in auto sales. Excluding autos, sales in February jumped a sharp 0.8 percent, following a 0.5 percent boost the month before. Excluding both autos and gasoline, February sales spiked 0.9 percent, following a 0.5 percent rise in January. The February jump in overall sales was broad based. Analysts had expected February’s snow storms to chill consumer spending for the month. Apparently, consumers more than caught up on spending when the snow melted as February sales were much stronger than expected. Overall retail sales in February rose 0.3 percent after rebounding 0.1 percent in January. But the gain was far better after discounting a drop in auto sales. Excluding autos, sales in February jumped a sharp 0.8 percent, following a 0.5 percent boost the month before. Excluding both autos and gasoline, February sales spiked 0.9 percent, following a 0.5 percent rise in January. The February jump in overall sales was broad based.
With consumer confidence still weak overall, apparently consumers with jobs are now making up for those without. Most likely, those with jobs are more confident that the economy will stay strong enough for them to keep their jobs.
On a final note for retail sales, the numbers point to a healthy gain in personal consumption expenditures in the first quarter for goods outside of motor vehicles. Notably, retail sales excluding autos, building materials, and gasoline jumped 0.9 percent in February after a 0.6 percent gain the month before. This series is used by the Commerce Department to estimate key portions of goods PCEs in GDP. The latest numbers should add to estimates for first quarter GDP growth.
 In contrast to the boost in retail sales, consumer sentiment remains quite glum. The Reuters/University of Michigan consumer sentiment index slipped back in the mid-March reading to 72.5 from February's 73.6. Both current conditions and expectations dipped with expectations showing particular weakness. Apparently, consumers without jobs have become gloomier about prospects in the near term. Initial jobless claims are stuck at a relatively high level and the median number of weeks of unemployment is also quite high, adding to the pessimism of the jobless. At 2.8 percent one-year out, inflation expectations at least remain subdued and, for those earning a paycheck, are not a risk for spending power. In contrast to the boost in retail sales, consumer sentiment remains quite glum. The Reuters/University of Michigan consumer sentiment index slipped back in the mid-March reading to 72.5 from February's 73.6. Both current conditions and expectations dipped with expectations showing particular weakness. Apparently, consumers without jobs have become gloomier about prospects in the near term. Initial jobless claims are stuck at a relatively high level and the median number of weeks of unemployment is also quite high, adding to the pessimism of the jobless. At 2.8 percent one-year out, inflation expectations at least remain subdued and, for those earning a paycheck, are not a risk for spending power.
 A narrower-than-expected trade deficit for January should help bump up estimates for first quarter GDP growth. The overall U.S. trade deficit unexpectedly shrank in January despite higher oil prices, falling to $37.3 billion from a revised $39.9 billion in December. Exports slipped 0.3 percent but imports fell a sharper 1.7 percent. A narrower-than-expected trade deficit for January should help bump up estimates for first quarter GDP growth. The overall U.S. trade deficit unexpectedly shrank in January despite higher oil prices, falling to $37.3 billion from a revised $39.9 billion in December. Exports slipped 0.3 percent but imports fell a sharper 1.7 percent.
The improvement in the trade deficit was about evenly split between the petroleum and nonpetroleum balances. The petroleum deficit came in at $22.7 billion, down from $23.6 billion in December as barrels imported fell significantly. The nonpetroleum gap narrowed to $25.4 billion from $26.9 billion in December.
The decreases in exports and imports were broad based by components but with those for imports more notable. January exports and imports both followed strong gains in December as exports jumped 3.4 percent that month and imports surged 4.9 percent in December.
 It would have been nice for the eight-month streak of gains in exports to continue but there are always oscillations in any series. Taking into account recent strong gains, the January dip in exports may or may not mean much in terms of overseas demand. In the context of recent gains in retail sales, the contraction in imports also likely reflects the spike in December. It would have been nice for the eight-month streak of gains in exports to continue but there are always oscillations in any series. Taking into account recent strong gains, the January dip in exports may or may not mean much in terms of overseas demand. In the context of recent gains in retail sales, the contraction in imports also likely reflects the spike in December.
 Businesses now may have cleaned out their stockroom shelves as much as needed to bring them in line with sales. This is good news for the recovery. Business inventories were unchanged in January after slipping 0.3 percent in December. Businesses now may have cleaned out their stockroom shelves as much as needed to bring them in line with sales. This is good news for the recovery. Business inventories were unchanged in January after slipping 0.3 percent in December.
For the latest month, manufacturers added 0.2 percent to inventories. Offsets came from wholesale inventories, down 0.2 percent, and retailer inventories, down 0.1 percent.
Basically, we may soon see businesses adding to inventories if there are further signs of a strengthening in final demand. The latest retail sales numbers suggest that is happening.
The economy handed out mixed news this past week. The advance in retail sales was quite a positive while the improvement in the trade gap likely was just noise in the data (with both exports and imports coming off big increases the month before). But the weak consumer sentiment number acted as a reminder that there now may be developing a two-track economy—those with jobs and those without.
Markets are barraged with market movers, starting with industrial production on Monday and housing starts on Tuesday. Inflation numbers are updated with PPI on Wednesday and CPI on Thursday. Of course, traders will pause Tuesday afternoon to read the latest tea leaves from the Fed’s FOMC statement.
The Empire State manufacturing index in February jumped nearly 9 points to 24.91 -- a reading that indicated substantial month-to-month acceleration in the region's manufacturing conditions. February’s figure was a rebound as this index had hit a recent high of 33.44 in October of this past year. Looking ahead, forward momentum for New York State manufacturing may be pausing as the new orders index eased to 8.78 from 20.48 in December. Nonetheless, it is still above breakeven, indicating modestly positive growth.
Empire State Manufacturing Survey Consensus Forecast for March 10: 22.0
Range: 17.2 to 23.0
Industrial production in January advanced 0.9 percent, following a 0.7 percent jump in December. Importantly, the manufacturing component made a robust comeback, jumping 1.0 percent after edging down 0.1 percent the month before. A big chunk of the manufacturing spike was due to a jump in auto assemblies—but gains were healthy elsewhere. The overall capacity utilization rate is still low but rose to 72.6 percent from 71.9 percent in December. Looking ahead, early warnings for the February number are mixed. Although the Philly Fed and New York Fed manufacturing indexes rose for February, the ISM index edged back. All three, however, remained in positive territory, implying positive growth. In contrast, production worker hours for the month fell 0.9 percent, according to the February employment situation numbers. Analysts expect weaker auto production to help pull down the manufacturing component. But higher utilities output from atypically cold February weather could support the headline production number.
Industrial production Consensus Forecast for February 10: 0.0 percent
Range: -0.4 to +0.2 percent
Capacity utilization Consensus Forecast for February 10: 72.4 percent
Range: 70.7 to 72.7 percent
Housing starts in January rebounded 2.8 percent after dipping 0.7 percent in December. January’s annualized pace of 0.591 million units was up 21.1 percent on a year-ago basis. The January comeback was led by a 9.2 percent increase in multifamily starts while the single-family component edged up 1.5 percent. February snow storms likely slowed starts down during the month. Focus should be more on permits as they are less affected by weather during a given month.
Housing starts Consensus Forecast for February 10: 0.565 million-unit rate
Range: 0.530 million to 0.591 million-unit rate
The FOMC announcement for the March 16 FOMC policy meeting is expected to leave the fed funds target rate unchanged at a range of zero to 0.25 percent. However, focus will be on any news on the Fed’s balance-sheet exit strategy, including whether there is progress on moving toward using the interest rate paid on reserves as a new target rate. Also, there is a possibility that the Board could announce another 25 basis point increase in the discount rate as the Fed has recently announced that it is gradually moving toward a normalization of the spread between the discount rate and the fed funds target rate (traditionally 100 basis points but currently 50 basis points).
FOMC Consensus Forecast for 3/16/10 policy vote on fed funds target range: unchanged at a range of zero to 0.25 percent
The producer price index in January jumped 1.4 percent after rising 0.4 percent in December. At the core level, the PPI increased to a 0.3 percent gain after a flat reading in December. The headline increase was led by a 5.1 percent surge in energy costs with gasoline up 11.5 percent. Food costs also were up notably, gaining 0.4 but down from 1.3 percent in December. On a seasonally adjusted basis, oil prices were down slightly in February and this will likely weigh on the headline number. But cold weather damage to Florida crops probably will boost food prices.
PPI Consensus Forecast for February 10: -0.2 percent
Range: -0.3 to +0.1 percent
PPI ex food & energy Consensus Forecast for February 10: +0.1 percent
Range: 0.0 to +0.2 percent
The consumer price index rose a moderate 0.2 percent in January despite upward pressure from energy costs. The headline number has cross currents as oil prices were seasonally weak in February but food prices could be up (cold weather damage to Florida vegetables and fruits). But expect the core to be soft as shelter costs remain weak.
CPI Consensus Forecast for February 10: +0.1 percent
Range: 0.0 to +0.2 percent
CPI ex food & energy Consensus Forecast for February 10: +0.1 percent
Range: 0.0 to +0.2 percent
Initial jobless claims for the March 6 week remained stubbornly high, slipping only 6,000 to 462,000 and driving up the four-week average by 5,000 to 475,500 for the highest level since November when claims first broke below 500,000.
Jobless Claims Consensus Forecast for 3/13/10: 455,000
Range: 445,000 to 460,000
The Conference Board's index of leading indicators in January decelerated to a rise of 0.3 percent from robust gains of 1.2 percent in December and 1.1 percent in November. For February, analysts expect only a modest gain.
Leading indicators Consensus Forecast for February 10: +0.2 percent
Range: 0.0 to +0.4 percent
The general business conditions component of the Philadelphia Fed's business outlook survey index in February improved to 17.6 from 15.2 the prior month. The Philly index in the latest month was at its highest since the 26.2 mark set September 2004. Strength is likely to continue in March as the new orders index really accelerated to 22.7 from January's 3.2.
Philadelphia Fed survey Consensus Forecast for March 10: 18.0
Range: 14.0 to 19.0
Quadruple Witching
R. Mark Rogers is the author of The Complete Idiot’s Guide to Economic Indicators, Penguin Books, October 2009.
Econoday Senior Writer Mark Pender contributed to this article.
|
