|
Economists and traders keep looking for the turning point in employment when it turns positive and stays positive. Some had expected February to be the month—until severe snow storms hit major sections of the U.S. Payroll jobs slipped in February—but would they have been positive without the adverse weather' That debate rages on. While the employment situation is uncertain, it strongly appears that manufacturing and construction are headed in opposite directions.
 This past week there was a steady barrage of economic indicators that mostly topped expectations—though generally by modest amounts. Nonetheless, the cumulative effect was to lift equities significantly—especially for small caps. At the start of the week, personal income was soft but the wages & salaries component posted a notable gain, trumping the ISM manufacturing index coming in a little below expectations. Motor vehicle sales edged down but the modest decline was seen as a win, given how hard snow storms cut into showroom traffic. ADP employment for February was down but only marginally—setting up hopes for a good payroll number on Friday. The ISM non-manufacturing index unexpectedly moved higher into positive territory. This past week there was a steady barrage of economic indicators that mostly topped expectations—though generally by modest amounts. Nonetheless, the cumulative effect was to lift equities significantly—especially for small caps. At the start of the week, personal income was soft but the wages & salaries component posted a notable gain, trumping the ISM manufacturing index coming in a little below expectations. Motor vehicle sales edged down but the modest decline was seen as a win, given how hard snow storms cut into showroom traffic. ADP employment for February was down but only marginally—setting up hopes for a good payroll number on Friday. The ISM non-manufacturing index unexpectedly moved higher into positive territory.
On Thursday, two labor market indicators distracted traders from a plunge in pending home sales. Initial jobless claims dropped significantly and nonfarm labor productivity was revised up more than anticipated. The latter is good for profits prospects. Also on Thursday, monthly chain store sales topped forecasts. At week end, a better-than-expected employment situation for February boosted equities significantly. Shortly before close, markets got another lift from an unexpected rise in consumer credit—indicating that bank charge offs are easing and consumers may be picking up the pace for spending.
Also adding to the week’s gains was the increased belief that the Greek debt situation would be managed by various institutions in Europe and that there would be no default by Greece. Many stock indexes ended the week at 52-week highs.
Equities were up this past week. The Dow was up 2.3 percent; the S&P 500, up 3.1 percent; the Nasdaq, up 3.9 percent; and the Russell 2000, up 6.0 percent.
For the year-to-date, major indexes are up as follows: the Dow, up 1.3 percent; the S&P 500, up 2.1 percent; the Nasdaq, up 2.5 percent; and the Russell 2000, up 6.5 percent.
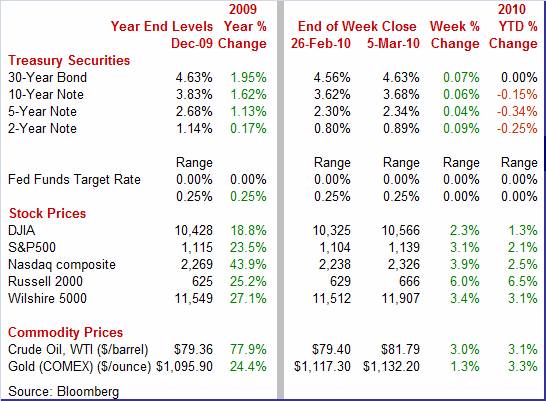
Weekly percent change column reflects percent changes for all components except interest rates. Interest rate changes are reflected in simple differences.
 Treasury yields showed little movement during the first four days of the week and actually netted down slightly for most maturities over that period despite mostly positive data on economic growth. Favoring soft rates were a flat core PCE price index, a Beige Book indicating that price pressures were subdued, and a strong productivity report. But all of those factors were offset by Friday’s better than expected employment report for February. The 2-year note did spike earlier on Thursday on changes in expectations (upward) for the jobs report the next day. Net, Treasury yields were up moderately for the week. Treasury yields showed little movement during the first four days of the week and actually netted down slightly for most maturities over that period despite mostly positive data on economic growth. Favoring soft rates were a flat core PCE price index, a Beige Book indicating that price pressures were subdued, and a strong productivity report. But all of those factors were offset by Friday’s better than expected employment report for February. The 2-year note did spike earlier on Thursday on changes in expectations (upward) for the jobs report the next day. Net, Treasury yields were up moderately for the week.
For this past week Treasury rates were up as follows: 3-month T-bill, up 4 basis points; the 2-year note, up 9 basis points; the 5-year note, up 4 basis points; the 7-year note, up 5 basis points; the 10-year bond, up 6 basis points; and the 30-year bond, up 7 basis points.
 Spot prices for West Texas Intermediate firmed notably for the past week on healthy economic news for the most part. Much of the week, the dollar edged down as worries over Greek debt eased. The dip in the dollar put upward pressure on oil and other commodities. By the end of the week, however, the dollar was about unchanged. The big lift for oil essentially came from mostly favorable economic news—especially with Friday’s jobs report. Also, the government’s mid-week petroleum status report showed refinery operating rates had climbed to the highest level since October. Spot prices for West Texas Intermediate firmed notably for the past week on healthy economic news for the most part. Much of the week, the dollar edged down as worries over Greek debt eased. The dip in the dollar put upward pressure on oil and other commodities. By the end of the week, however, the dollar was about unchanged. The big lift for oil essentially came from mostly favorable economic news—especially with Friday’s jobs report. Also, the government’s mid-week petroleum status report showed refinery operating rates had climbed to the highest level since October.
Net for the week, spot prices for West Texas Intermediate firmed $2.39 per barrel to settle at $81.79 – the highest daily settle since $82.52 on January 11, 2010.
We saw another month of modest job losses in February but there is a wide range of opinion on how much adverse weather affected the numbers. Meanwhile, we got two favorable reports from ISM and a personal income report that was mixed. But things are not looking good for housing and other construction activity.
 Severe weather in February did not have as much impact on jobs numbers as feared. But government layoffs are now weighing on the numbers. Nonfarm payroll employment in February declined 36,000, following a revised 26,000 decrease in January and revised fall of 109,000 for December. The February payroll decline was less negative than the market forecast for a 50,000 fall in employment. The January and December revisions were up a net 35,000. Severe weather in February did not have as much impact on jobs numbers as feared. But government layoffs are now weighing on the numbers. Nonfarm payroll employment in February declined 36,000, following a revised 26,000 decrease in January and revised fall of 109,000 for December. The February payroll decline was less negative than the market forecast for a 50,000 fall in employment. The January and December revisions were up a net 35,000.
Weakness in February was led by a 64,000 drop in construction jobs. Rounding out the goods-producing sector, manufacturing actually edged up 1,000 and mining rose 4,000. Service-providing jobs were up 42,000 in February, following a 20,000 increase the month before. The highlight was temp help being up 48,000 in the latest month. Government jobs fell 18,000 despite the hiring of 15,000 temporary Census workers. At the federal level, the U.S. Postal Service cut 9,000 jobs. Local governments shrank their work forces by 31,000 in the latest month.
 On the issue of snow storms potentially lowering payroll jobs, the Labor Department made a point to include a special memo that stated that workers are counted as employed for the month if they receive pay for any portion of the pay period—for example, even just one hour. So, even if workers had fewer hours, they were still counted as employed. Hence, the impact of the snow storms likely was exaggerated headed into the report. But if you believe that February payroll numbers were pushed down by bad weather, then there could be a significant bounce up in March. On the issue of snow storms potentially lowering payroll jobs, the Labor Department made a point to include a special memo that stated that workers are counted as employed for the month if they receive pay for any portion of the pay period—for example, even just one hour. So, even if workers had fewer hours, they were still counted as employed. Hence, the impact of the snow storms likely was exaggerated headed into the report. But if you believe that February payroll numbers were pushed down by bad weather, then there could be a significant bounce up in March.
Wage inflation in February eased to an anemic 0.1 percent rise from 0.2 percent the month before. The average workweek (traditional series for production & nonsupervisory workers) slipped to 33.1 hours in February from 33.3 the month before. One of the biggest negatives in the report is a drop in the manufacturing workweek to 39.5 hours from 39.9 in January (traditional series).
 From the household survey, the unemployment rate held steady at 9.7 percent in February. But an expanded definition of unemployment worsened. Those unemployed, marginally attached to the labor force, or working part-time due to economic reasons rose to 16.8 percent from 16.5 percent the month before. Also, the duration of unemployment remains quite high at 19.4 weeks, down from 19.9 weeks in January. From the household survey, the unemployment rate held steady at 9.7 percent in February. But an expanded definition of unemployment worsened. Those unemployed, marginally attached to the labor force, or working part-time due to economic reasons rose to 16.8 percent from 16.5 percent the month before. Also, the duration of unemployment remains quite high at 19.4 weeks, down from 19.9 weeks in January.
It’s hard to really determine the direction of momentum this month given the heavy snow storms. However, two divergent movements stand out. The rise in temp help is good news but the drop in local government and USPS employees may portend more job cuts within government.
 There are reasons that employment is still weak. First, there is sluggish final demand. But right up there with that is the push by companies to cut labor costs. We see this in recent labor productivity numbers. Nonfarm business productivity for the fourth quarter was revised up to a sharp 6.9 percent boost from the initial estimate of 6.2 percent. This followed a revised 7.8 percent surge in the third quarter. These numbers carried over to lower production costs. Unit labor costs fell an annualized 5.9 percent in the fourth quarter, compared to an initial estimate of minus 4.4 percent and a revised third quarter plunge of 7.6 percent. Year-on-year, productivity rose to 5.8 percent in the fourth quarter from 4.6 percent in the third quarter. Year-ago unit labor costs fell to minus 4.7 percent from down 2.7 percent the previous quarter. Yes, businesses are getting leaner and meaner to compete—but it means a soft labor market for now. It also means lower inflation pressures—giving the Fed flexibility to keep rates low. There are reasons that employment is still weak. First, there is sluggish final demand. But right up there with that is the push by companies to cut labor costs. We see this in recent labor productivity numbers. Nonfarm business productivity for the fourth quarter was revised up to a sharp 6.9 percent boost from the initial estimate of 6.2 percent. This followed a revised 7.8 percent surge in the third quarter. These numbers carried over to lower production costs. Unit labor costs fell an annualized 5.9 percent in the fourth quarter, compared to an initial estimate of minus 4.4 percent and a revised third quarter plunge of 7.6 percent. Year-on-year, productivity rose to 5.8 percent in the fourth quarter from 4.6 percent in the third quarter. Year-ago unit labor costs fell to minus 4.7 percent from down 2.7 percent the previous quarter. Yes, businesses are getting leaner and meaner to compete—but it means a soft labor market for now. It also means lower inflation pressures—giving the Fed flexibility to keep rates low.
 Just like the prior report, you had to dig into the details to figure out what really happened with personal income. Overall personal income rose only 0.1 percent in January, after a 0.3 percent boost the month before. The softening was due to a return to trend in farm income after a jump in that component in December. The true measure of strength in income for consumers is the wages and salaries component which jumped 0.4 percent in the latest month after edging up 0.1 percent in December. Just like the prior report, you had to dig into the details to figure out what really happened with personal income. Overall personal income rose only 0.1 percent in January, after a 0.3 percent boost the month before. The softening was due to a return to trend in farm income after a jump in that component in December. The true measure of strength in income for consumers is the wages and salaries component which jumped 0.4 percent in the latest month after edging up 0.1 percent in December.
Both personal income and the wages and salaries component are still sluggish on a year-ago basis with personal income up just 1.1 percent in January and the latter component down 1.1 percent.
The spending numbers also required some extra digging. A 0.5 percent rise for personal consumption was stronger than expected but, given a 1.8 percent surge in non-durable goods, looks to have been boosted by gasoline. Spending on durable goods rose only 0.1 percent with spending on services up a moderate 0.2 percent.
The inflation numbers were a little warm at the headline level but core readings were very soft. For January, the headline number was up 0.2 percent but the core reading was flat. On a year-ago basis, the January headline PCE price index came in at 2.1 percent while the core PCE was up only 1.4 percent.
 Demand in February had to be at least moderately healthy for motor vehicles sales to only slip to 10.4 million units from 10.8 million in January due to severe snow storms across major sections of the U.S. Domestic makes held up the better, dipping 2.2 percent in the latest month while import totals dropped 7.9 percent. Imports were weighed down by Toyota’s recall-related stoppage of sales on certain models. The import share of the total slipped to 25.7 percent from 26.9 percent in January. This is down from the historical high of 30.5 percent set in February 2009 when GM and Chrysler where at the height of financial difficulties. Demand in February had to be at least moderately healthy for motor vehicles sales to only slip to 10.4 million units from 10.8 million in January due to severe snow storms across major sections of the U.S. Domestic makes held up the better, dipping 2.2 percent in the latest month while import totals dropped 7.9 percent. Imports were weighed down by Toyota’s recall-related stoppage of sales on certain models. The import share of the total slipped to 25.7 percent from 26.9 percent in January. This is down from the historical high of 30.5 percent set in February 2009 when GM and Chrysler where at the height of financial difficulties.
 It’s not huge but it’s in the right direction—and it points to both that banks’ bleeding bad debt is slowing and that consumers are more willing to spend. But bear in mind that these improvements are modest. Consumer credit broke a record cycle of decline in January, rising $5.0 billion and led by a $6.6 billion rise in non-revolving credit (car loans, mobile homes, education, boats, trailers, vacations). But revolving credit (credit cards) still declined, down $1.7 billion but much less moderate than December's $9.4 billion plunge. But the bottom line is that we may have hit the cycle low for consumer debt difficulties. Still, this does not mean that further improvement is going to be rapid. It’s not huge but it’s in the right direction—and it points to both that banks’ bleeding bad debt is slowing and that consumers are more willing to spend. But bear in mind that these improvements are modest. Consumer credit broke a record cycle of decline in January, rising $5.0 billion and led by a $6.6 billion rise in non-revolving credit (car loans, mobile homes, education, boats, trailers, vacations). But revolving credit (credit cards) still declined, down $1.7 billion but much less moderate than December's $9.4 billion plunge. But the bottom line is that we may have hit the cycle low for consumer debt difficulties. Still, this does not mean that further improvement is going to be rapid.
 The ISM index eased back in February to 56.5 from 58.4 the month before. But the latest number is still at a healthy level above break even, indicating moderate growth in manufacturing activity. The composite index has been above 50 for seven months in a row. Manufacturing improvement is spreading to employment as this index rose nearly 3 points in February to a very strong 56.1, indicating that manufacturers are starting to rehire to meet assembly line demand. New orders were also strong but did moderate to 59.5, breaking a string of exceptionally strong plus-60 readings. The ISM index eased back in February to 56.5 from 58.4 the month before. But the latest number is still at a healthy level above break even, indicating moderate growth in manufacturing activity. The composite index has been above 50 for seven months in a row. Manufacturing improvement is spreading to employment as this index rose nearly 3 points in February to a very strong 56.1, indicating that manufacturers are starting to rehire to meet assembly line demand. New orders were also strong but did moderate to 59.5, breaking a string of exceptionally strong plus-60 readings.
 Boosted by significant improvement in employment, the ISM's non-manufacturing index rose 2.5 points to 53.0 to signal month-on-month growth for the bulk of the U.S. economy. Employment jumped 4 points to 48.6 for the best reading since April 2008. February's new orders were moderately healthy at 55.0, showing the strongest rate of month-to-month growth since August 2007. Boosted by significant improvement in employment, the ISM's non-manufacturing index rose 2.5 points to 53.0 to signal month-on-month growth for the bulk of the U.S. economy. Employment jumped 4 points to 48.6 for the best reading since April 2008. February's new orders were moderately healthy at 55.0, showing the strongest rate of month-to-month growth since August 2007.
A close reading of the latest report indicates that non-manufacturing strength is in services. Within the list of contracting industries were construction and real estate. Notable services industries declining were educational services and health care & social assistance.
 The construction sector is remaining a drag on the economy. January construction spending dropped 0.6 percent after sinking 1.2 percent in December. On the year, total construction has declined by 9.3 percent. Weakness in the latest month was led by a 2.1 percent fall in private nonresidential spending with public outlays slipping 0.7 percent. The bright spot was private residential construction spending which was up 1.3 percent on the month after dropping 2.8 percent in December. But even that component is likely to fall back if home sales continue to decline and the latest evidence suggest that is the case. The construction sector is remaining a drag on the economy. January construction spending dropped 0.6 percent after sinking 1.2 percent in December. On the year, total construction has declined by 9.3 percent. Weakness in the latest month was led by a 2.1 percent fall in private nonresidential spending with public outlays slipping 0.7 percent. The bright spot was private residential construction spending which was up 1.3 percent on the month after dropping 2.8 percent in December. But even that component is likely to fall back if home sales continue to decline and the latest evidence suggest that is the case.
 According to the National Association of Realtors, the pending home sales index dropped 7.6 percent in January after edging up 0.8 percent in December and falling 13.7 percent in November. Sales simply have fallen over a cliff since the initial boost over the summer and early autumn from tax credits to first-time homebuyers. Weather may help explain some of the January dip but it is apparent that the tax credits boosted sales more than originally realized and not just general improvement in the economy. January’s drop was seen in all Census regions with the West falling the most—13.2 percent—which was not as affected bad weather as much as other areas. Declines elsewhere were the Northeast, down 8.7 percent; the Midwest, down 9.0 percent; and the South, down 2.1 percent. Still, we may get another bounce upward in coming months as the latest round of tax credits for homebuyers expires in April. According to the National Association of Realtors, the pending home sales index dropped 7.6 percent in January after edging up 0.8 percent in December and falling 13.7 percent in November. Sales simply have fallen over a cliff since the initial boost over the summer and early autumn from tax credits to first-time homebuyers. Weather may help explain some of the January dip but it is apparent that the tax credits boosted sales more than originally realized and not just general improvement in the economy. January’s drop was seen in all Census regions with the West falling the most—13.2 percent—which was not as affected bad weather as much as other areas. Declines elsewhere were the Northeast, down 8.7 percent; the Midwest, down 9.0 percent; and the South, down 2.1 percent. Still, we may get another bounce upward in coming months as the latest round of tax credits for homebuyers expires in April.
There are several cross currents in the economy. Manufacturing remains healthy and growing; the consumer sector is holding up reasonably well given the headwinds; but housing may be slipping from recent gains. Importantly, the labor market is still struggling to improve. The worst from the past recession is behind us but cost cutting by companies and modest demand is keeping unemployment high and consumer spending soft.
Manufacturers will be watching the international trade report on Thursday to see if exports continue their string of gains. On Friday, traders will be picking apart the February retail sales numbers for how much snow storms impacted activity.
The U.S. Treasury monthly budget report posted a deficit of $42.6 billion in January, bringing the year-on-year rise in the fiscal year-to-date deficit down to 8.8 percent from 16.8 percent in December. The improvement came from the outlay side which was down 3.9 percent from a year ago. In particular, outlays related to TARP fell to $125 million, compared to December's $3.9 billion. Looking ahead, for historical perspective, the month of February typically shows a deficit for the month. Over the past 10 years, the average deficit has been $108.0 billion and $144.3 billion over the past 5 years. The February 2009 deficit came in at $192.8 billion.
Treasury Statement Consensus Forecast for February 10: -$223.0 billion
Range: -$225 billion to -$180 billion.
The U.S. international trade gap in December unexpectedly ballooned to $40.2 billion from a $36.4 billion gap in November. The worsening in the trade deficit was largely due to a widening of the petroleum deficit as the nonpetroleum gap actually shrank. The good news was that exports jumped 3.3 percent in December—the eighth consecutive monthly increase. The trade gap could worsen again in January as the seasonally adjusted price of West Texas Intermediate jumped about 9 percent on a monthly basis.
International trade balance Consensus Forecast for January 10: -$41.0 billion
Range: -$43.0 billion to -$39.0 billion
Initial jobless claims for the week of February 27 swung lower, declining 29,000 to 469,000. There were no special factors in the week. Filings were up the prior week due to severe weather. Now many file online rather than waiting in line and being snowed in at home may have actually boosted online filings. The weekly data for February showed steep swings. The four-week average, however, fell 3,500 in the week to 470,750, a level showing no significant change from late January.
Jobless Claims Consensus Forecast for 3/6/10: 460,000
Range: 450,000 to 470,000
Retail sales in January posted a healthy rebound of 0.5 percent after dipping 0.1 percent the month before. Excluding autos, sales in January were up 0.6 percent, following December’s drop of 0.2 percent. Components were mixed with gasoline playing an essentially neutral role. Excluding both autos and gasoline, January sales rebounded 0.6 percent, following a 0.3 percent decrease in December. Better-than-expected store sales for February have raised hopes that February will continue the uptrend in overall retail sales. But unit new motor vehicles sales fell 4.2 percent for the month and likely will dampen retail sales.
Retail sales Consensus Forecast for February 10: -0.2 percent
Range: -0.8 to +0.3 percent
Retail sales excluding motor vehicles Consensus Forecast for February 10: 0.0 percent
Range: -0.6 to +0.5 percent
The Reuter's/University of Michigan's Consumer sentiment index edged lower in February, extending the recent recession's run of very weak readings. Reuters/University of Michigan's consumer sentiment index for the full month of February slipped to 73.6 from 73.7 at mid month and compared to 74.4 in January. Expectations dipped lower in the latest report while current conditions improved. Most analysts are counting on a little bounce back but higher gasoline prices and a weak labor market likely will keep sentiment low in March.
Consumer sentiment Consensus Forecast for preliminary March 10: 74.0
Range: 72.0 to 75.0
Business inventories slipped 0.2 percent in December after two moderate gains of 0.5 percent in November and 0.3 percent in October. For the latest month, the decline was led by a 0.8 percent fall in wholesale inventories. A large part of wholesale inventories are imports. The other two components of business inventories also were soft with manufacturing inventories dipping 0.1 percent and retail inventories unchanged. More recently, factory inventories rose 0.2 percent in January. We will get an update on wholesale inventories for January on Wednesday, March 10.
Business inventories Consensus Forecast for January 10: +0.2 percent
Range: 0.0 to +0.6 percent
R. Mark Rogers is the author of The Complete Idiot’s Guide to Economic Indicators, Penguin Books, October 2009.
Econoday Senior Writer Mark Pender contributed to this article.
|
