|
The recovery may be slowing in the first quarter even though we just got an upward revision to fourth quarter GDP. Two of the reasons that economic growth may be easing are that housing has stalled and consumer confidence has fallen. Yes, there are other reasons, but these two stood out this past week.
 Economic news and credit worries in Europe weighed on equities despite assurance from the Fed that interest rates will remain low for an extended period. Stocks took their biggest hit this past week on Tuesday when consumer confidence unexpectedly dropped, stooping to a 10-month low. Also, a dip in the headline Case-Shiller home price index weighed on equities. Economic news and credit worries in Europe weighed on equities despite assurance from the Fed that interest rates will remain low for an extended period. Stocks took their biggest hit this past week on Tuesday when consumer confidence unexpectedly dropped, stooping to a 10-month low. Also, a dip in the headline Case-Shiller home price index weighed on equities.
Stocks bumped back up on Wednesday when Fed Chairman Ben Bernanke stated that interest rates would remain low for an extended period. His comments were not really news to Fed watchers but equity traders decided to be in a positive mood anyway and despite a plunge in new home sales the same day.
 Equities on Thursday mostly fell on mixed economic data. A jump in initial jobless claims outweighed a rise in durables orders, pushing stocks down. Worries over Greece’s debt crisis also came into play. President Obama’s health care summit also caused jitters about the impact on business. Stocks were mixed on Friday and mostly little changed despite the report of a sharp quarterly loss by AIG, a plummet in existing home sales, and a dip in consumer sentiment. Real GDP growth for Q4 was revised up but final sales were revised down. On the positive side, the Chicago PMI was a little stronger than expected. Overall, equities continued to adjust to a slowing in the recovery. Equities on Thursday mostly fell on mixed economic data. A jump in initial jobless claims outweighed a rise in durables orders, pushing stocks down. Worries over Greece’s debt crisis also came into play. President Obama’s health care summit also caused jitters about the impact on business. Stocks were mixed on Friday and mostly little changed despite the report of a sharp quarterly loss by AIG, a plummet in existing home sales, and a dip in consumer sentiment. Real GDP growth for Q4 was revised up but final sales were revised down. On the positive side, the Chicago PMI was a little stronger than expected. Overall, equities continued to adjust to a slowing in the recovery.
Equities were down this past week. The Dow was down 0.7 percent; the S&P 500, down 0.4 percent; the Nasdaq, down 0.3 percent; and the Russell 2000, down 0.5 percent.
Equities were up in February with healthy gains overall. The Dow was up 2.6 percent; the S&P 500, up 2.9 percent; the Nasdaq, up 4.2 percent; and the Russell 2000, up 4.4 percent.
For the year-to-date, major indexes are mostly down as follows: the Dow, down 1.0 percent; the S&P 500, down 1.0 percent; and the Nasdaq, down 1.4 percent. The Russell 2000 is now up 0.5 percent.
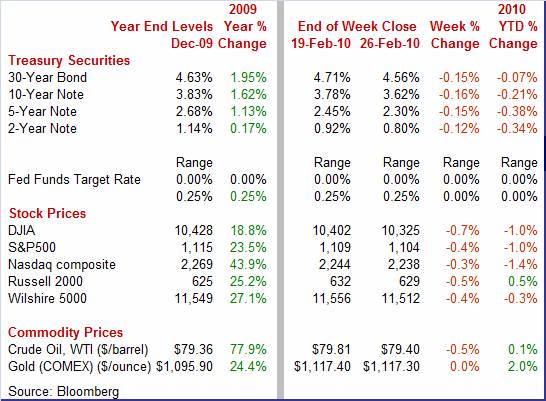
Weekly percent change column reflects percent changes for all components except interest rates. Interest rate changes are reflected in simple differences.
 Yields on Treasuries were down sharply this past week, pushed down by economic news and flight to safety. Rates were little changed at the start of the week but took a dive on Tuesday on the drop in consumer confidence. Adding to further declines during the week were falls in home sales, lower consumer sentiment, and flight to safety on both stock losses and worries over Greek sovereign debt. Yields on Treasuries were down sharply this past week, pushed down by economic news and flight to safety. Rates were little changed at the start of the week but took a dive on Tuesday on the drop in consumer confidence. Adding to further declines during the week were falls in home sales, lower consumer sentiment, and flight to safety on both stock losses and worries over Greek sovereign debt.
 For this past week Treasury rates were down significantly as follows except on the short end: the 2-year note, down 12 basis points; the 5-year note, down 15 basis points; the 7-year note, down 18 basis points; the 10-year bond, down 16 basis points; and the 30-year bond, down 15 basis points. The 3-month T-bill edged up 1 basis point. For this past week Treasury rates were down significantly as follows except on the short end: the 2-year note, down 12 basis points; the 5-year note, down 15 basis points; the 7-year note, down 18 basis points; the 10-year bond, down 16 basis points; and the 30-year bond, down 15 basis points. The 3-month T-bill edged up 1 basis point.
The yield curve remains moderately steepened with the Fed keeping short-term rates low and markets worried about supply and inflation’s impact on the long end.
 Crude oil prices eased slightly this past week on net negative economic news. The spot price for West Texas Intermediate started the week with a mild boost in prices on worries about strikes at French refineries. But prices fell sharply on Tuesday on the drop in consumer confidence. At mid-week, the oil market decided to react positively to Fed Chairman Ben Bernanke’s Congressional testimony that rates will remain low for an extended period—not really new news but sometimes markets just choose a particular direction. And oil jumped on Bernanke’s testimony despite a drop in new home sales. Oil fell on Thursday on a spike in initial jobless claims. At week end, oil traders chose to interpret the economic news as they wanted. Economists generally saw the downward revision to final sales in Q4 GDP as a negative and outweighing the upward revision to overall GDP—the difference being a bigger contribution from inventories. Still, economic news was net negative and oil dipped for the week overall. Crude oil prices eased slightly this past week on net negative economic news. The spot price for West Texas Intermediate started the week with a mild boost in prices on worries about strikes at French refineries. But prices fell sharply on Tuesday on the drop in consumer confidence. At mid-week, the oil market decided to react positively to Fed Chairman Ben Bernanke’s Congressional testimony that rates will remain low for an extended period—not really new news but sometimes markets just choose a particular direction. And oil jumped on Bernanke’s testimony despite a drop in new home sales. Oil fell on Thursday on a spike in initial jobless claims. At week end, oil traders chose to interpret the economic news as they wanted. Economists generally saw the downward revision to final sales in Q4 GDP as a negative and outweighing the upward revision to overall GDP—the difference being a bigger contribution from inventories. Still, economic news was net negative and oil dipped for the week overall.
Net for the week, spot prices for West Texas Intermediate slipped $0.41 per barrel to settle at $79.40.
This past week, housing and consumer confidence took center stage—and both were struggling. Whenever GDP comes out, that report often is the highlight of the week. To some, the second estimate to GDP was, but the detail of that report indicated that the recovery is softening in the near term as did housing and confidence. But there was one moderately bright spot—manufacturing, according to the latest durables report.
 The economy does not have as much forward momentum as suggested by the latest headline number for GDP. Real GDP growth for the fourth quarter was revised upward to an annualized 5.9 percent from the initial estimate of 5.7 percent. The market forecast was for a net unrevised second estimate. The economy does not have as much forward momentum as suggested by the latest headline number for GDP. Real GDP growth for the fourth quarter was revised upward to an annualized 5.9 percent from the initial estimate of 5.7 percent. The market forecast was for a net unrevised second estimate.
The higher estimate reflected more positive contributions from private inventory investment, exports, personal consumption expenditures (PCE), and nonresidential fixed investment. Imports, which are a subtraction in the calculation of GDP, increased.
 The problem with the latest number is that overall strength for the quarter increasingly was in the inventory component as businesses slowed the pace of destocking. Final sales growth was revised to a more modest 1.9 percent increase from the original estimate of 2.2 percent. The change in real private inventories added 3.9 percentage points to fourth quarter GDP, compared to 3.4 percentage points in the initial estimate. Businesses are unlikely to boost inventories until final demand strengthens. This softness in final demand likely will keep the recovery sluggish in the near term. The problem with the latest number is that overall strength for the quarter increasingly was in the inventory component as businesses slowed the pace of destocking. Final sales growth was revised to a more modest 1.9 percent increase from the original estimate of 2.2 percent. The change in real private inventories added 3.9 percentage points to fourth quarter GDP, compared to 3.4 percentage points in the initial estimate. Businesses are unlikely to boost inventories until final demand strengthens. This softness in final demand likely will keep the recovery sluggish in the near term.
Within final sales, there was some strength in investment in equipment & software, posting an 18.2 percent jump. Residential investment advanced but at a much slower pace than in the third quarter. PCEs rose a modest 1.7 percent in the latest period. Net exports shrank by $10.3 billion with exports spiking 22.4 percent and imports gaining 15.3 percent annualized. Nonresidential structures fell sharply while government purchases fell slightly.
Year-on-year, real GDP improved to up 0.1 percent from minus 2.6 percent in the third quarter.
On the inflation front, the GDP price index was revised down to a 0.4 percent rise, compared to the original estimate of an annualized 0.6 percent. The latest number corroborates the Fed’s view that inflation is not a problem for now.
Overall, the recovery continues but not as strong as hoped, based on final sales.
 Both new and existing home sales in January fell sharply, indicating that the improvement in housing has stalled or even reversed. New single-family home sales dropped a sharp 11.2 percent in January after dipping 3.9 percent the month before. The January annualized pace of 309,000 was down 6.1 percent on a year-ago basis. For the latest month, homes for sale (inventories) edged up incrementally to 234,000 from 233,000 in December, but the drop in sales resulted in months’ supply jumping to 9.1 months from 8.0 months in December. Both new and existing home sales in January fell sharply, indicating that the improvement in housing has stalled or even reversed. New single-family home sales dropped a sharp 11.2 percent in January after dipping 3.9 percent the month before. The January annualized pace of 309,000 was down 6.1 percent on a year-ago basis. For the latest month, homes for sale (inventories) edged up incrementally to 234,000 from 233,000 in December, but the drop in sales resulted in months’ supply jumping to 9.1 months from 8.0 months in December.
 Existing home sales have plunged since the tax credit induced surge in the autumn. Existing home sales fell 7.2 percent in January after falling 16.2 percent in December. January's annual rate of 5.05 million was much lower than rates of 5.44 million units in December and the stimulus-boosted 6.49 million for November. Supply jumped back up, rising to 7.8 months from December's 7.2 months and November's 6.5 months. Existing home sales have plunged since the tax credit induced surge in the autumn. Existing home sales fell 7.2 percent in January after falling 16.2 percent in December. January's annual rate of 5.05 million was much lower than rates of 5.44 million units in December and the stimulus-boosted 6.49 million for November. Supply jumped back up, rising to 7.8 months from December's 7.2 months and November's 6.5 months.
Basically, sales were propped up in the fall by the tax credit for first-time homebuyers. The credit originally was scheduled to expire at the end of November. This boost was especially true for existing home sales which were under greater downward price pressure (cheaper) than new homes. Looking ahead, we may see a modest encore rebound over the next three months of data as the second round of homebuyer tax credits expires at the end of April.
 It is tough to sort out the real trend in home prices from the four major indicators—especially since they are defined differently. The biggest and most current moves have come from the new and existing home sales reports. According to the Census Bureau’s new home sales report, the median price dropped 5.6 percent in January to $203,500 and followed a 1.6 percent dip in December. Also for January, the National Association of Realtors reported that the median price for existing single-family homes dropped 3.5 percent to $163,600 after edging up 0.2 percent in December. It is tough to sort out the real trend in home prices from the four major indicators—especially since they are defined differently. The biggest and most current moves have come from the new and existing home sales reports. According to the Census Bureau’s new home sales report, the median price dropped 5.6 percent in January to $203,500 and followed a 1.6 percent dip in December. Also for January, the National Association of Realtors reported that the median price for existing single-family homes dropped 3.5 percent to $163,600 after edging up 0.2 percent in December.
 These were rather large moves for home prices in just one month. And there are two reasons for that—these two series are not seasonally adjusted and the composition of types of homes sold is not constant and can shift sharply each month. During winter, demand is seasonally the weakest and so are prices. These were rather large moves for home prices in just one month. And there are two reasons for that—these two series are not seasonally adjusted and the composition of types of homes sold is not constant and can shift sharply each month. During winter, demand is seasonally the weakest and so are prices.
 The Case-Shiller and the FHFA reports take care of these problems although the Case-Shiller headline number does not as it is not seasonally adjusted. Both the S&P’s Case-Shiller and the Federal Housing Finance Agency’s indexes are for repeat purchases. The Case-Shiller and the FHFA reports take care of these problems although the Case-Shiller headline number does not as it is not seasonally adjusted. Both the S&P’s Case-Shiller and the Federal Housing Finance Agency’s indexes are for repeat purchases.
The headline Case-Shiller 20-city composite came in weak, declining 0.2 percent in December (latest available), matching November’s dip and falling for the third consecutive month. But the headline number is not seasonally adjusted. Looking further into that report, the seasonally adjusted numbers are still positive but softening. The seasonally adjusted 20-city composite rose 0.3 percent in January, equaling the rise the month before. This version of Case-Shiller has increased in six of the last seven months (September 2009 was flat). But recent numbers are much softer than those seen during last summer when even seasonally adjusted prices were rising in the 1 percent vicinity.
The FHFA series is pointing to more weakness than Case-Shiller. Home prices for federal agency sponsored mortgages declined 1.6 percent in December after rising 0.4 percent in November on a seasonally adjusted basis. Housing prices appear to be under new downward pressure as foreclosures are rising and there is no surge in demand as earlier in the summer and autumn with the early effects of tax credits for first-time homebuyers. Tax credits were still in effect in December but the boost in demand has waned.
Between Case-Shiller and FHFA, the first is the broader measure as it covers all types of home loans and does not have ceilings on the size of the home loan. The FHFA series is for conventional loans only (no FHA and no VA loans) and has a ceiling for the size of loans (no high end loans). The FHFA series is based on home loans originated or bundled by Fannie Mae and Freddie Mac.
On a year-ago basis, the median price for Census new homes sold was down 2.4 percent in January, compared to 6.1 percent in December. The median price for single-family existing homes sold in January came in at minus 0.4 percent, up from minus 3.1 percent the month before. The Case-Shiller 20-city composite (SA) was down 3.1 percent in December 2009, improved from down 5.3 percent the month before. The FHFA purchase only index was down 1.5 percent in December after being up 0.1 percent in November.
 The odds of the economy getting a boost soon from the consumer sector just went down, according to the latest surveys on the consumers’ view of the economy. Indeed, the consumer's mood is definitely downbeat, reflecting a jobs market that is not improving and income growth that is stagnant. The Conference Board's consumer confidence index fell back sharply in February, dropping nearly 10 points to 46.0. This is the lowest level since the 40.8 reading for April 2009 but is still above the recession low of 25.3 seen in February 2009. Expectations, the index's leading component, fell more than 13 points last month to 63.8 reflecting a sweeping sentiment downturn in income, employment, and business conditions. But the view for current conditions is even worse as this index dipped nearly 6 points to an abysmal 19.4 and the lowest reading since 17.5 set in February 1983. Weakness is clearly tied to pessimism over the jobs market. Only 6.2 percent of the survey sample describes job prospects as good. A miniscule 3.6 percent describes jobs as currently plentiful with 47.7 percent calling them as hard to get. The odds of the economy getting a boost soon from the consumer sector just went down, according to the latest surveys on the consumers’ view of the economy. Indeed, the consumer's mood is definitely downbeat, reflecting a jobs market that is not improving and income growth that is stagnant. The Conference Board's consumer confidence index fell back sharply in February, dropping nearly 10 points to 46.0. This is the lowest level since the 40.8 reading for April 2009 but is still above the recession low of 25.3 seen in February 2009. Expectations, the index's leading component, fell more than 13 points last month to 63.8 reflecting a sweeping sentiment downturn in income, employment, and business conditions. But the view for current conditions is even worse as this index dipped nearly 6 points to an abysmal 19.4 and the lowest reading since 17.5 set in February 1983. Weakness is clearly tied to pessimism over the jobs market. Only 6.2 percent of the survey sample describes job prospects as good. A miniscule 3.6 percent describes jobs as currently plentiful with 47.7 percent calling them as hard to get.
The Reuters/University of Michigan consumer sentiment index also turned down in the latest month, slipping to 73.6 for the February final reading from. 73.7 at mid month and from 74.4 in January. In contrast to the Conference Board measures, the Michigan current conditions index is doing better than expectations. Current conditions actually rose in February to 81.8 from 81.1 in January. Expectations declined to 68.4 in February from 70.1 the month before and point to weak sentiment ahead.
The bottom line is that both surveys find the consumer in a glum mood—one that is certainly going to weigh on spending in coming months.
 Watching the durables orders report is like watching a ping pong match. You can count on a lot of back and forth. For major indicators, it is the most volatile and also is heavily revised. At the headline level, new orders for durable goods in January posted a healthy 3.0 percent gain, following a revised 1.9 percent rebound in December. The December increase had previously been estimated to be 0.3 percent. But excluding transportation, we get a different picture for January as new durables orders fell 0.6 percent after a 2.0 percent gain in December. A big offsetting factor to the dip in the core was that December was revised up significantly from the original 0.9 percent rise. Overall, the headline number for January exaggerates strength but the core number is OK for such a volatile series after the upward revision to December. Watching the durables orders report is like watching a ping pong match. You can count on a lot of back and forth. For major indicators, it is the most volatile and also is heavily revised. At the headline level, new orders for durable goods in January posted a healthy 3.0 percent gain, following a revised 1.9 percent rebound in December. The December increase had previously been estimated to be 0.3 percent. But excluding transportation, we get a different picture for January as new durables orders fell 0.6 percent after a 2.0 percent gain in December. A big offsetting factor to the dip in the core was that December was revised up significantly from the original 0.9 percent rise. Overall, the headline number for January exaggerates strength but the core number is OK for such a volatile series after the upward revision to December.
What’s the recent trend for durables' Basically, durables have been on an uptrend since spring 2009. The average monthly percent change for the headline starting in April 2009 through January is 1.1 percent. For the core, this average is 0.9 percent.
What moved the overall number for January' Transportation spiked 15.6 percent after a 1.5 percent rise the month before. For the latest month, nondefense aircraft surged a monthly 126.0 percent; defense aircraft rose 11.6 percent; and motor vehicles slipped 2.2 percent. The core slipped but weakness was rather narrow—most components posted gains. The 0.6 percent dip was led by a sharp 9.7 drop in new orders for machinery after a 7.4 percent rise in December. Otherwise, gains in the core were widespread.
What had been progress in housing now appears to be stalling or even slipping. Meanwhile, the consumer sector is not getting much traction. These are pointing to a softening in the recovery.
We get two heavy hitter reports book ending this week with personal income on Monday and the all-important employment situation report on Friday. But markets also will take note of the ISM manufacturing report on Monday.
Personal income in December advanced 0.4 percent, following a gain of 0.5 percent in November. But where it really counts, income barely rose. The important wages and salaries component edged up 0.1 percent after improving 0.4 percent increase in November. Strength in December income was in proprietors' income (notably, the farm component) and in rental income. Personal consumption expenditures (nominal) posted only a 0.2 percent gain in December, following a 0.7 percent boost the month before. Inflation was quite soft in December as headline PCE price inflation slowed further in December, rising only 0.1 percent, following a 0.3 percent rise the month before. Meanwhile, core PCE inflation in December firmed incrementally to a 0.1 percent increase, following no change in November. Looking ahead, the wages & salaries component should have a healthy gain in January based on a 0.6 percent boost in aggregate weekly earnings. But the farm component of proprietors’ income could reverse course and weigh in personal income. Personal spending is likely to be soft despite a strong gain in January retail sales. Unit new motor vehicle sales were down for the month. The core PCE price index should be close to the 0.1 percent dip in the core CPI for January.
Personal income Consensus Forecast for January 10: +0.4 percent
Range: +0.3 to +0.6 percent
Personal consumption expenditures Consensus Forecast for January 10: +0.4 percent
Range: +0.2 to +0.6 percent
Core PCE price index Consensus Forecast for January 10: 0.0 percent
Range: -0.1 to +0.1 percent
The composite index from the ISM manufacturing survey in January jumped more than 3 points to 58.4 for its sixth straight month in positive territory. Looking ahead, the index should remain strong in February as the January new orders index posted its third straight reading over 60, rising more than 1 point to 65.9.
ISM manufacturing composite index Consensus Forecast for February 10: 57.5
Range: 55.0 to 60.0
Construction spending for December dropped another 1.2 percent, following a revised decrease of 1.2 percent in November. Weakness in December was led by decreases in private residential spending and by public outlays. Given recent weakness in home sales, commercial vacancy rates, and state & local government revenues, another negative month for January is likely. Housing starts did rebound 2.8 percent in January and that may help soften a possible decline in construction outlays.
Construction spending Consensus Forecast for January 10: -0.8 percent
Range: -1.1 to 0.0 percent
Sales of domestic light motor vehicles in January fell to an adjusted annual unit rate of 7.9 million, a sizable decline from December's rate of 8.4 million. Lost sales at Toyota, the result of the company's paralyzing gas-pedal recall, were not fully made up by sales at other manufacturers. The rate of decline at Toyota was the deepest of any maker, at an unadjusted month-to-month minus 45 percent for cars and minus 47 percent for trucks. Total sales for domestics and imports slipped to 10.8 million units annualized from 11.2 million units in December – a 4.2 percent decline for the latest month. Sales in February also are likely to be soft, reflecting the expanded travails of Toyota.
Motor vehicle domestic sales Consensus Forecast for February 10: 7.9 million-unit rate
Range: 7.4 to 8.3 million-unit rate
The composite index from the ISM non-manufacturing survey in January rose 7 tenths to 50.5, indicating flat conditions for the bulk of the economy. This is consistent with services and construction lagging manufacturing in the recovery. But the non-manufacturing portion of the economy may be strengthening soon. The new orders index rose more than 2-1/2 points in January to 54.7, higher into positive territory and the strongest reading in more than two years.
ISM non-manufacturing composite index Consensus Forecast for February 10: 51.0
Range: 49.5 to 52.5
The Beige Book being prepared for the March 16 meeting is released this afternoon. Traders will be culling the Beige Book on a variety of issues including the direction of the labor market, whether home prices are slipping again, the strength of consumer spending, home sales, and whether banks are lending more. Some see the risk of a double dip recession as increased, so this Beige Book may have more impact than in recent months.
Initial jobless claims for the February 20 week jumped 22,000 to 496,000--the highest level since November. The four-week average, up 6,000 to 473,750, was also the highest since November and is more than 15,000 higher than January levels. Continuing claims, where data lags by a week, were slightly higher at 4.617 million and were little changed from January levels. Looking ahead, analysts are hoping that the recent increases in claims are just technical and are calling for an offsetting dip this week.
Jobless Claims Consensus Forecast for 2/27/10: 475,000
Range: 460,000 to 490,000
Nonfarm productivity in the initial estimate for the fourth quarter came in at a strong 6.2 percent annualized boost, following a revised third quarter 7.2 percent gain. Unit labor costs declined again, dropping an annualized 4.4 percent in the fourth quarter, following a revised 1.5 percent dip the prior quarter. The fourth quarter boost in productivity reflected a 7.2 percent surge in output, following a 2.2 percent gain the prior quarter. Hours worked actually rebounded a modest 1.0 percent after a 4.7 percent annualized drop in the third quarter. Looking ahead, the upcoming revision to fourth quarter numbers should nudge productivity a little higher and bump unit costs down based on the 0.2 percentage point upward revision to fourth quarter GDP (to 5.9 percent annualized growth).
Nonfarm Productivity Consensus Forecast for revised Q4 09: +6.3 percent annual rate
Range: +5.9 to +6.6 percent annual rate
Unit Labor Costs Consensus Forecast for revised Q4 09: -4.5 percent annual rate
Range: -5.9 to -4.0 percent annual rate
Factory orders rose solidly in December, advancing 1.0 percent on top of a 1.0 percent gain in November. Strength in orders was split evenly between durable goods and non-durable goods, both up 1.0 percent. More recently, new orders for durable goods in January posted a healthy 3.0 percent gain, following an upwardly revised 1.9 percent rebound in December. The December increase had previously been estimated to be 0.3 percent.
Factory orders Consensus Forecast for January 10: +2.0 percent
Range: +0.5 to +2.7 percent
Nonfarm payroll employment in January fell a modest 20,000, following a 150,000 drop in December and gain of 64,000 for November. The January decline was led by a 60,000 drop in the goods-producing sector which included a 75,000 decrease in construction. The service providing sector rebounded 48,000 after dropping 69,000 in December. Wage inflation in January edged up to a 0.2 percent increase, following a 0.1 percent gain the month before. From the household survey, the unemployment rate declined to 9.7 percent from 10.0 percent in December. Based on a recent worsening in initial jobless claims, many analysts are expecting a larger dip in payroll jobs in February even though temporary hiring for the Census will add significantly. Severe snow storms are expected to dampen jobs also. Similarly, the unemployment rate is projected to rise also in part due to a technical rebound from January’s atypically large decline.
Nonfarm payrolls Consensus Forecast for February 10: -50,000
Range: -150,000 to +30,000
Unemployment rate Consensus Forecast for February 10: 9.8 percent
Range: 9.6 to 10.0 percent
Average workweek Consensus Forecast for February 10: 33.6 hours
Range: 33.2 to 33.8 hours
Average hourly earnings Consensus Forecast for February 10: +0.2 percent
Range: +0.1 to +0.2 percent
Consumer credit outstanding fell at a slower pace in December, declining a modest $1.8 billion net. But there were sharp differences in components with revolving credit contracting a sharp $8.5 billion which was mostly offset by a $6.8 billion increase in nonrevolving credit. This latter component was boosted by solid vehicle sales. Look for a worsening in the overall decline in consumer credit in January as motor vehicle sales declined and banks continue to charge off credit card debt.
Consumer credit Consensus Forecast for January 10: -$4.0 billion
Range: -$10.0 billion to -$3.0 billion
R. Mark Rogers is the author of The Complete Idiot’s Guide to Economic Indicators, Penguin Books, October 2009.
Econoday Senior Writer Mark Pender contributed to this article.
|
