|
While markets were mulling over the impact of a new president on the U.S. economy, the economic news turned worse – especially for employment. An official recession has not yet been declared but it is clear we are in one.
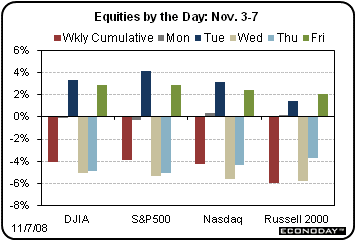 Equities are having a tough time putting together two winning weeks or even days. This past week, stocks gave back a big chunk of the prior week’s surge. Early in the week, stocks were mixed to slightly positive on chatter that the Treasury Department is seriously considering using a large part of its financial rescue funding to buy into not just banks and other traditional lenders but also bond insurers and specialty finance companies that could include units of General Electric and Citigroup. Also, on Tuesday traders increasingly believed that that Obama would win the presidential election. This reduced uncertainty led some investors to be more willing to jump into companies that some saw as benefitting from an Obama win. In turn, more investors were willing to get out of cash and take positions. Equities are having a tough time putting together two winning weeks or even days. This past week, stocks gave back a big chunk of the prior week’s surge. Early in the week, stocks were mixed to slightly positive on chatter that the Treasury Department is seriously considering using a large part of its financial rescue funding to buy into not just banks and other traditional lenders but also bond insurers and specialty finance companies that could include units of General Electric and Citigroup. Also, on Tuesday traders increasingly believed that that Obama would win the presidential election. This reduced uncertainty led some investors to be more willing to jump into companies that some saw as benefitting from an Obama win. In turn, more investors were willing to get out of cash and take positions.
But after the election, the economy retook center stage. Stocks fell sharply on very negative economic news on Wednesday and Thursday. Weighing on equities were a jump in layoffs according to Challenger, a sharp decline in private payroll employment according to ADP, and a jump in continuing jobless claims. Also, there was dismal news from chain store retailers – with discounters such as Wal-Mart being exceptions.
News that GM and Ford were rapidly using up their cash to maintain operations also unsettled the markets during the latter part of the week. The employment situation on Friday was very negative but markets had largely built in a big decline in payroll employment after negative labor market reports on Wednesday and Thursday. Some traders even had built in a 300,000 plunge in payroll employment as of late Thursday – and stocks rose on Friday when the worst case scenario did not happen.
The bottom line is that credit markets have stabilized somewhat (which is not the same as saying that they have improved) and economic news is having more impact on equities. And the latest news has been quite negative – and equities have responded accordingly.
Equities were down this past week. The Dow was down 4.1 percent; the S&P 500, down 3.9 percent; the Nasdaq, down 4.3 percent; and the Russell 2000, down 5.9 percent.
For the year-to-date, major indexes are down as follows: the Dow, down 32.6 percent; the S&P 500, down 36.6 percent; the Nasdaq, down 37.9 percent; and the Russell 2000, down 34.0 percent.
Weekly percent change column reflects percent changes for all components except interest rates. Interest rate changes are reflected in simple differences.
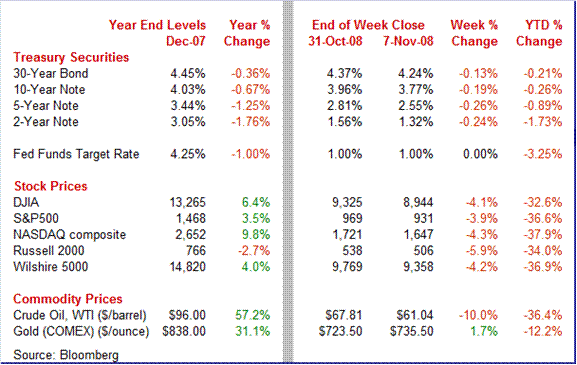
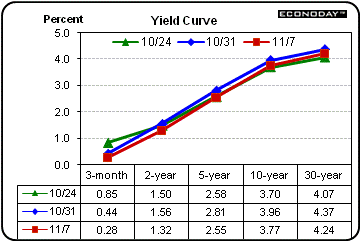 Treasury yields eased this past week on weak economic data and on a firming dollar. The negative economic news was just about nonstop all week. ISM manufacturing dropped to lows not seen since the early 1980s; chain store retail sales were anemic; continuing jobless claims spiked; payroll job losses topped 200,000 for the second straight month and the unemployment rate surged. Also helping Treasury yields ease were: signs that the credit markets are loosening up, firming in the dollar, and further declines in oil prices. Treasury yields eased this past week on weak economic data and on a firming dollar. The negative economic news was just about nonstop all week. ISM manufacturing dropped to lows not seen since the early 1980s; chain store retail sales were anemic; continuing jobless claims spiked; payroll job losses topped 200,000 for the second straight month and the unemployment rate surged. Also helping Treasury yields ease were: signs that the credit markets are loosening up, firming in the dollar, and further declines in oil prices.
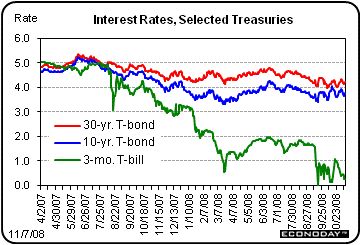 For this past week Treasury rates were down as follows: 3-month T-bill, down 16 basis points, the 2-year note, down 24 basis points; the 5-year note, down 26 basis points; the 10-year bond, down 19 basis points; and the 30-year bond, down 13 basis points. For this past week Treasury rates were down as follows: 3-month T-bill, down 16 basis points, the 2-year note, down 24 basis points; the 5-year note, down 26 basis points; the 10-year bond, down 19 basis points; and the 30-year bond, down 13 basis points.
A softer economy has helped longer rates come down somewhat. On the near end, rate cutting overseas and increased expectations that the Fed will cut the fed funds target by 50 basis points at its mid-December policy meeting have led the 3-month bill back down.
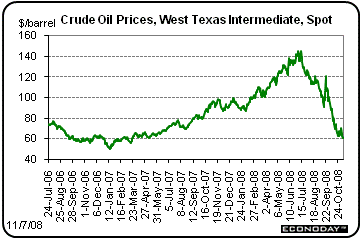 Oil prices continued downward, hitting lows not seen in well over a year and a half. The story was not complicated for most of the week. Negative economic data suggested a softening in demand. Nudging the spot price of West Texas Intermediate down during this past week was the same negative economic news that led Treasury rates to ease – including for both ISM reports, ADP employment, Challenger job layoffs, continuing unemployment claims, and the employment situation for October. Also, rate cuts by central banks overseas helped support the dollar, which in turn helped oil to ease. The rate cut by the European Central Bank was as expected but the Bank of England cut its policy rate significantly more than markets had projected with a 150 basis point drop. The Reserve Bank of Australia also was part of the rate cutting party this past week with a large 75 basis point rate cut. Also, the Swiss National Bank made an unexpected rate cut while several Asian banks lowered rates as well, including those in India and South Korea. Oil prices continued downward, hitting lows not seen in well over a year and a half. The story was not complicated for most of the week. Negative economic data suggested a softening in demand. Nudging the spot price of West Texas Intermediate down during this past week was the same negative economic news that led Treasury rates to ease – including for both ISM reports, ADP employment, Challenger job layoffs, continuing unemployment claims, and the employment situation for October. Also, rate cuts by central banks overseas helped support the dollar, which in turn helped oil to ease. The rate cut by the European Central Bank was as expected but the Bank of England cut its policy rate significantly more than markets had projected with a 150 basis point drop. The Reserve Bank of Australia also was part of the rate cutting party this past week with a large 75 basis point rate cut. Also, the Swiss National Bank made an unexpected rate cut while several Asian banks lowered rates as well, including those in India and South Korea.
Net for the week, spot prices for West Texas Intermediate fell $6.77 per barrel to settle at $61.04 – and coming in $84.25 below the record settle of $145.29 per barrel set on July 3.
The third quarter showed a mild contraction. But the way the fourth quarter indicators are going at the outset, the recession clearly is getting deeper and there is every indication that the fourth quarter decline will be sharp. Although construction is still on a broad downtrend, housing is no longer the lone reason for negative growth. Joining as contributors to the downturn are larger job losses and a retrenchment in consumer spending.
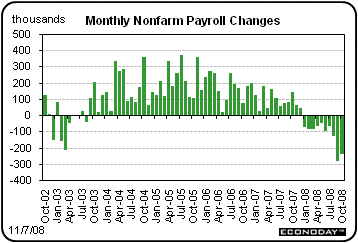 The October jobs report came in significantly worse than expected – showing acceleration in the pace of contraction for the economy. Nonfarm payroll employment in October plummeted 240,000, following a revised drop of 284,000 in September and a revised decrease of 127,000 in August. Payroll jobs have fallen for 10 consecutive months. For the year-to-date, the economy has lost 1.2 million jobs net. Job declines are no longer modest enough to allow incremental growth in the overall economy. The October jobs report came in significantly worse than expected – showing acceleration in the pace of contraction for the economy. Nonfarm payroll employment in October plummeted 240,000, following a revised drop of 284,000 in September and a revised decrease of 127,000 in August. Payroll jobs have fallen for 10 consecutive months. For the year-to-date, the economy has lost 1.2 million jobs net. Job declines are no longer modest enough to allow incremental growth in the overall economy.
The labor market has weakened significantly, confirmed by a spike in the unemployment rate. The civilian unemployment rate jumped to 6.5 percent in October from 6.1 percent the month before and is at its highest since 6.5 percent set in March 1994.
 Back to payroll jobs. How does the current trend in payroll losses compare to the 2001 recession' Surprisingly, the cumulative losses so far are less than the losses during the first 10 months into the 2001 downturn – which actually lasted only from March 2001 through November 2001. From March 2001 through December 2001 (job declines lasted longer than the overall recession), the economy lost a cumulative 1.8 million – over half a million more than over the latest 10 months. But at the 10 month point in 2001, the economy was starting to turn back up. In contrast, the current economy very much appears to be headed lower. Back to payroll jobs. How does the current trend in payroll losses compare to the 2001 recession' Surprisingly, the cumulative losses so far are less than the losses during the first 10 months into the 2001 downturn – which actually lasted only from March 2001 through November 2001. From March 2001 through December 2001 (job declines lasted longer than the overall recession), the economy lost a cumulative 1.8 million – over half a million more than over the latest 10 months. But at the 10 month point in 2001, the economy was starting to turn back up. In contrast, the current economy very much appears to be headed lower.
Indeed, the October report shows labor market weakness spreading. The latest job losses were widespread with few positives. The October drop was led by manufacturing and construction which fell by 90,000 and 49,000, respectively.
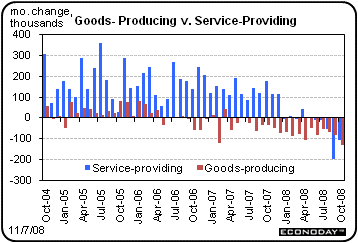
Service-providing jobs fell 108,000 after sliding 201,000 in September. In this category, trade & transportation dropped 67,000 while professional & businesses services declined 45,000. The only major categories with gains were education & health services and government — up 21,000 and 23,000, respectively.
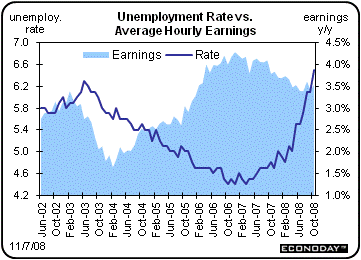 However, the Fed’s forecast that the slowing economy will help ease inflation pressures is starting to come true. Wage inflation is holding steady and is a little on the soft side. Average hourly earnings posted a 0.2 percent rise in October, matching both the boost the month before and the market forecast. Year-on-year, wages were little changed at 3.5 percent in October. However, the Fed’s forecast that the slowing economy will help ease inflation pressures is starting to come true. Wage inflation is holding steady and is a little on the soft side. Average hourly earnings posted a 0.2 percent rise in October, matching both the boost the month before and the market forecast. Year-on-year, wages were little changed at 3.5 percent in October.
Without a doubt, the October employment report shows the economy in a significant recession. Anecdotal evidence is that companies are still ramping up lay-offs and recent continuing jobless claims suggest that labor market weakness has not hit bottom. Declines in employment also mean sluggish income growth – which cuts into the strength of the consumer sector. More specifically, we can expect more retrenchment by consumers over job losses and fears of job losses. It is likely to be a disappointing holiday season for retailers.
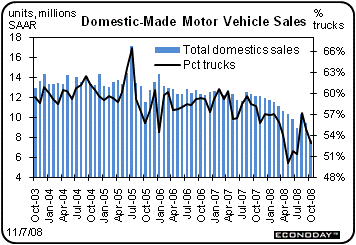 Already, a weak jobs picture and tight credit are wreaking havoc for auto dealerships. In October, motor vehicle sales were abysmal. Total domestic-made light vehicle sales came in at a pathetic 7.7 million annual unit sales rate. The rate was the lowest since the early 80s, also a time of recession. The combined rate of 10.6 million is also at its lowest since the early 1980s. Already, a weak jobs picture and tight credit are wreaking havoc for auto dealerships. In October, motor vehicle sales were abysmal. Total domestic-made light vehicle sales came in at a pathetic 7.7 million annual unit sales rate. The rate was the lowest since the early 80s, also a time of recession. The combined rate of 10.6 million is also at its lowest since the early 1980s.
The auto industry is ailing currently and domestic manufacturers are taking the harder hits. October was a distressing month for all auto companies but hardest hit was GM with a 45.1 percent drop in unit sales in October compared to October 2007. Not far behind was Chrysler with a 34.9 percent fall and even Nissan North America with a 33.0 percent decline.
For the cumulative year-to-date, U.S. manufacturers clearly are having sales stall the most. Chrysler is down 25.9 percent with GM and Ford showing cumulative sales off 20.4 percent and 18.6 percent, respectively. Major imports are down far less with Toyota USA slipping 11.5 percent, American Honda falling 3.2 percent, and Nissan North America declining 6.2 percent.
The latest motor vehicle sales numbers point to probably negative retail sales for October along with at least the durables portion of personal consumption falling for the month. In turn, weak personal consumption will probably help fourth quarter GDP decline significantly.
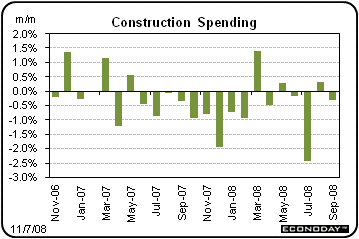 Construction is still tugging the economy downward. Construction outlays fell 0.3 percent in September, following a revised 0.1 percent dip in August. Also, July and August numbers were revised down notably. Weakness in the latest month was led by declines in private residential and public construction – both fell 1.3 percent for September. The private nonresidential component rebounded 1.2 percent. Construction is still tugging the economy downward. Construction outlays fell 0.3 percent in September, following a revised 0.1 percent dip in August. Also, July and August numbers were revised down notably. Weakness in the latest month was led by declines in private residential and public construction – both fell 1.3 percent for September. The private nonresidential component rebounded 1.2 percent.
Within the residential component, single-family construction dropped 4.7 percent after a 4.0 percent fall in August. Multifamily outlays posted a partial rebound of 2.7 percent, following a 6.6 decrease in August.
Leading the rebound in private nonresidential construction were a 5.2 percent turnaround in manufacturing and a 2.5 percent rise in power construction outlays.
On a year-on-year basis, overall construction outlays were unchanged at down 6.6 percent in September.
We can expect construction to continue lower for some time. Tight mortgage credit, pullbacks in investment by businesses, and weak revenues for state and local governments point to continued negative numbers in coming months.
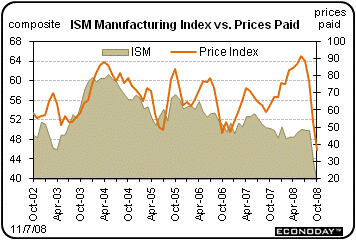 There are indications that the contraction is manufacturing is worsening. The ISM's manufacturing index fell to 38.9 in October, down from 43.5 in September and far below the break-even 50 level to indicate that a much greater share of purchasing managers are reporting weakness than strength. Readings are at levels last seen in the early 1980s. Orders data were disheartening, coming in even worse than the composite. The new orders index dropped to 32.2 from 38.89 in September while backlog orders came in at 29.5 versus 35.0 the previous month. Even export orders, which had a key source of strength, fell well below breakeven, reflecting dollar strength and weakening demand from foreign economies. There are indications that the contraction is manufacturing is worsening. The ISM's manufacturing index fell to 38.9 in October, down from 43.5 in September and far below the break-even 50 level to indicate that a much greater share of purchasing managers are reporting weakness than strength. Readings are at levels last seen in the early 1980s. Orders data were disheartening, coming in even worse than the composite. The new orders index dropped to 32.2 from 38.89 in September while backlog orders came in at 29.5 versus 35.0 the previous month. Even export orders, which had a key source of strength, fell well below breakeven, reflecting dollar strength and weakening demand from foreign economies.
Input prices have plummeted on the severe pullback in demand. The prices paid index fell more than 15 points to 37.0. The latest ISM manufacturing number points to lower manufacturing output for October and for the fourth quarter overall.
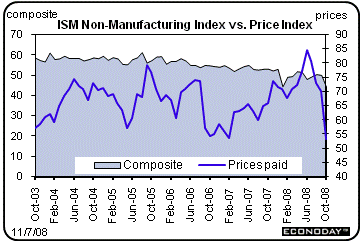 The ISM non-manufacturing index fell back into negative territory in Octobers, declining to 44.4 from 50.2 in September. The composite index has been below the breakeven level of 50 for 6 of 10 months this year. The ISM non-manufacturing index fell back into negative territory in Octobers, declining to 44.4 from 50.2 in September. The composite index has been below the breakeven level of 50 for 6 of 10 months this year.
But the biggest news from this report was a worsening in the employment index with a more than 3 point drop to 41.5. This is a record low for the index which tracks very closely with actual payroll changes.
As with the manufacturing index, the non-manufacturing prices paid fell sharply - by nearly 20 points to 53.
The latest economic reports show a deepening and widening of the current recession. The National Bureau of Economic Research (NBER) has not given an official date for the start of this recession (due to some borderline numbers late in 2007 and early 2008 which will be revised next year) but is now certain that we are in one and have been probably going back to the third quarter and even possibly the second quarter. Indeed, two economists on the NBER business cycle dating committee have stated that the economy is in recession – but they indicate there is still uncertainty over the start date. While policy moves by the Fed and Treasury have kept the recession from being as severe as it could be, there are more signs that the downturn is accelerating rather than improving. In turn, the contraction is likely to greater than the 1990-91 and 2001s recession but not a deep as in 1981-82.
It’s a shortened workweek for bond traders with Veterans’ Day closing the bond pits but traders in stocks and futures markets will be showing up for work on this holiday. There are only two market moving indicators out this week—monthly international trade and retail sales. Both will be important since two strong points in the economy earlier this year had been exports and consumer spending. But both – especially consumer spending – have been showing signs of weakness recently.
SIFMA recommended early close, 2:00 ET
Veterans’ Day, stocks and futures markets open.
The U.S. international trade gap in August narrowed notably - primarily due to a drop in oil imports. The overall U.S. trade gap narrowed to $59.1 billion from a $61.3 billion shortfall in July. In August, exports dropped 2.0 percent while imports fell 2.4 percent. Meanwhile the nonoil goods deficit worsened to $33.6 billion from $29.3 billion in July. Helping to lower the oil deficit was a drop in oil prices. Looking ahead, a further drop in oil prices will likely help the trade gap either narrow further or at least remain relatively unchanged.
International trade balance Consensus Forecast for September 08: -$57.0 billion
Range: -$59.0 billion to -$52.8 billion
Initial jobless claims for the week ending November 1 were little changed but the latest continuing claims jumped sharply. Initial claims edged down 4,000 in the latest week to 481,000 – remaining at an elevated level. Importantly, claims related to hurricanes in late August and early September were not notable factors. But continuing claims are pointing to a worsening in the labor markets. Continuing claims for unemployment insurance surged 122,000 in the October 25 week to a 25-year high of 3.843 million.
Jobless Claims Consensus Forecast for 11/8/08: 482,000
Range: 475,000 to 500,000
The U.S. Treasury monthly budget report showed surplus for September - a tax payment month - that was substantially less than expected, at $45.7 billion and was a much larger surplus than for September of last year at $112.9 billion. The fiscal year 2008 deficit came in at a record $454.8 billion compared to a much smaller deficit of $161.5 billion in fiscal 2007. Looking ahead, the month of October typically shows a moderate deficit for the month. Over the past 10 years, the average deficit for the month of October has been $39.3 billion and $55.5 billion over the past 5 years. But given continued deterioration in revenues and increased demands for expenditures, the October shortfall is likely to be dramatically higher.
Treasury Statement Consensus Forecast for October 08: -$92.0 billion
Range: -$210.0 billion to -$65.0 billion.
Retail sales in September came in far worse than expected, dropping 1.2 percent, following a 0.4 percent decline in August. Excluding motor vehicles, retail sales declined 0.6 percent in September, after a 0.9 percent drop the month before. Excluding motor vehicles and gasoline, retail sales decreased 0.7 percent, after slipping 0.6 percent the month before. Looking ahead, the overall sales figure for October is likely to decline on at least two counts—a sharp drop in gasoline prices during the month and a sizeable fall in unit new motor vehicle sales.
Retail sales Consensus Forecast for October 08: -1.9 percent
Range: -3.2 to -0.6 percent
Retail sales excluding motor vehicles Consensus Forecast for October 08: -1.0 percent
Range: -2.5 to +0.3 percent
Import prices have fallen back steeply the last two months, reflecting lower energy prices and also slowing demand. Import prices fell 3.0 percent in September after declining 2.6 percent the month before. But even excluding petroleum, import prices posted a rare month-to-month dip, down 0.9 percent for a record decline and the first decline in a year-and-a-half. This largely reflects a world-wide easing in demand for commodities. Looking ahead, more recent declines in oil prices and in other commodities should result in a sizeable decrease in import prices for October.
Import prices Consensus Forecast for October 08: -4.2 percent
Range: -8.0 to -1.0 percent
Business inventories are starting to grow more slowly—but probably not slow enough. Business inventories rose 0.3 percent in August while business sales fell 1.8 percent, pushing up the stock-to-sales ratio by 3 tenths to 1.27. Due to the recent drop in consumer spending, businesses are paring back on stocks to keep inventory costs down. More recent indicators suggest that stocks are still rising too fast—although there are not yet indications that any dramatic inventory overhang is developing. But the latest retail sales numbers for September have dropped off—along with unit new motor vehicle sales, suggesting retail inventories may be a little overstocked. Also, more recently, manufacturing inventories jumped 0.4 percent in September.
Business inventories Consensus Forecast for September 08: 0.0 percent
Range: -0.4 to +0.5 percent
The Reuter's/University of Michigan's Consumer sentiment index in October fell to 57.6 from September’s reading of 70.3. The assessment of current conditions weakened the most in October to 58.4. All readings were at or near record lows covering nearly 60 years of data.
Consumer sentiment Consensus Forecast for preliminary November 08: 56.0
Range: 48.6 to 65.0
Econoday Senior Writer Mark Pender contributed to this article.
|

